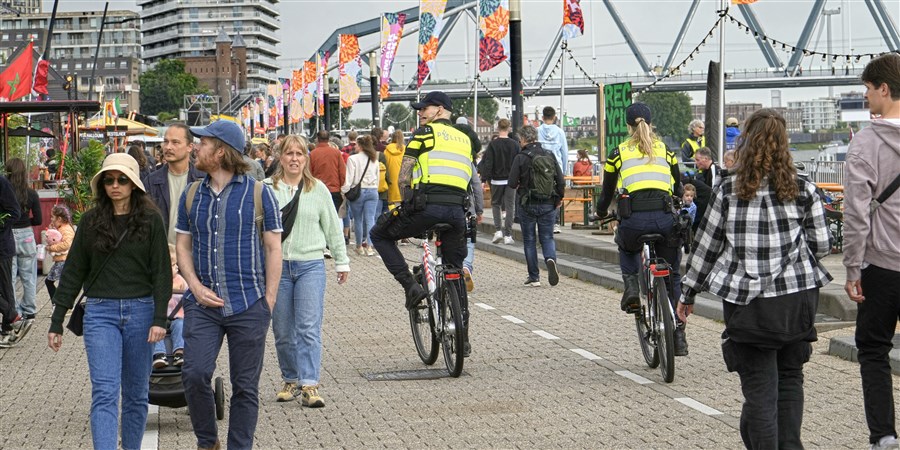
One-third are satisfied with police visibility in their neighbourhood
- 31 percent are satisfied with police visibility in their area, while 21 percent are dissatisfied.
- People in more urban areas are more satisfied with police visibility than those in less urban areas.
- 35 percent are satisfied and 8 percent are dissatisfied with police performance in their neighbourhood.
In 2025, 31 percent of the Dutch population were satisfied with police visibility in their neighbourhood, while 21 percent were dissatisfied. When it comes to police performance, 35 percent were satisfied and 8 percent were dissatisfied. This is reported by Statistics Netherlands (CBS) based on its 2025 Safety Monitor, a survey of people aged 15 or older that is carried out every two years. The proportion of satisfied residents was slightly lower than in 2021. Residents of urban areas are more likely to say they see the police regularly and are satisfied with their visibility than those living in less urbanised areas.
Higher police visibility leads to greater satisfaction
People who see the police more often in their neighbourhood generally have a more positive opinion of police visibility. 9 percent see the police frequently, of whom 79 percent say they are satisfied with this level of visibility. A total of 46 percent of those who sometimes see the police in their area (35 percent) are satisfied with police visibility.
Some people say they are (very) dissatisfied with the visibility of the police: 30 percent in areas where they rarely see the police (42 percent), and 39 percent in areas where people never see the police (14 percent).
| (Very) satisfied (% of people aged 15 and over) | Neither satisfied nor dissatisfied (% of people aged 15 and over) | (Very) dissatisfied (% of people aged 15 and over) | No opinion (% of people aged 15 and over) | |
|---|---|---|---|---|
| Total | 31.1 | 35.9 | 21.4 | 11.5 |
| Police visibility | ||||
| Regularly | 78.5 | 14.8 | 3.8 | 2.9 |
| Sometimes | 46.2 | 38.7 | 9.0 | 6.0 |
| Rarely | 16.0 | 41.4 | 29.6 | 13.0 |
| Never | 7.3 | 26.8 | 39.4 | 26.5 |
One-third of people are satisfied with police performance
Among people aged 15 and over, 35 percent are (very) satisfied with police performance in their area, 8 percent are (very) dissatisfied and 29 percent are neither satisfied nor dissatisfied. 28 percent said they had no opinion on this.
A total of 32 percent fully agree with the statement that the police provide protection for residents in their neighbourhood.
Furthermore, 28 percent agree with the statement that the local police meet their needs. 36 percent of people think that the police have little contact with local residents.
| (Completely) agree (% of people aged 15 and over) | Neither agree nor disagree (% of people aged 15 and over) | (Completely) disagree (% of people aged 15 and over) | No response (% of people aged 15 and over) | No opinion on police performance (% of people aged 15 and over) | |
|---|---|---|---|---|---|
| Police in this area... | |||||
| ... provide protection for residents | 32.2 | 27.9 | 8.8 | 3.3 | 27.8 |
| ... meet our needs | 27.6 | 5.7 | 10.5 | 27.8 | |
| ... are more accessible | 25.9 | 25.3 | 13 | 8.0 | 27.8 |
| ... handle problems effectively | 17.1 | 33.9 | 11.7 | 9.5 | 27.8 |
| ... collaborate well with residents | 14.8 | 33.5 | 13.5 | 10.3 | 27.8 |
| ... have little contact with residents | 35.7 | 23.4 | 7.1 | 6.0 | 27.8 |
| ... issue too few fines | 21.1 | 24.6 | 16.1 | 10.4 | 27.8 |
Satisfaction is higher among people who live in urban areas
In more urban areas, a larger proportion of residents say that the police are regularly visible compared to less urbanised areas. 18 percent of residents in highly urbanised areas say that police presence is high, compared to 3 percent in non-urban areas. The degree of urbanisation of an area is determined by the number of addresses it contains. The more addresses a specific neighbourhood has, the higher its degree of urbanisation.
Satisfaction with police visibility is also higher in more urban areas, but the differences are smaller than for visibility itself. The number of residents who are (very) satisfied with police visibility in their neighbourhood ranges from 36 percent in very highly urbanised areas to 29 percent in less urbanised or non-urban areas.
When it comes to the levels of dissatisfaction with police visibility, there is little difference between urbanised and non-urban areas: 20 percent of residents in both very highly urbanised and non-urban areas are (very) dissatisfied.
| Very highly urbanised (% of people aged 15 and over) | Highly urbanised (% of people aged 15 and over) | Moderately urbanised (% of people aged 15 and over) | Less urbanised (% of people aged 15 and over) | Non-urban (% of people aged 15 and over) | |
|---|---|---|---|---|---|
| Regularly visible | 18.1 | 9.5 | 5.9 | 4.6 | 3.1 |
| (Very) satisfied with police visibility | 36.2 | 30.7 | 28.8 | 28.5 | 28.5 |
Residents of urban areas are slightly more satisfied with police performance
In 2025, 36 percent of residents in very highly urbanised areas were satisfied with police performance in their neighbourhood, while 10 percent were dissatisfied. In non-urban areas, these shares were 34 percent and 7 percent, respectively. The number of residents who have no opinion on police performance ranges from 25 percent in very highly urbanised areas to 31 in non-urban areas.
Among residents of very highly urbanised areas, 37 percent say the police protect them, compared to 28 percent of residents in non-urban areas. They are also more likely to find the police more accessible.
In relative terms, residents of non-urban areas are more likely to say that the police have little contact with local residents.
| Categorie | Very highly urbanised (% of people aged 15 and over) | Highly urbanised (% of people aged 15 and over) | Moderately urbanised (% of people aged 15 and over) | Less urbanised (% of people aged 15 and over) | Non-urban (% of people aged 15 and over) |
|---|---|---|---|---|---|
| Police in this area… | |||||
| … provide protection for residents | 49.5 | 44.5 | 42.5 | 42.6 | 40.6 |
| … meet our needs | 40.2 | 38.9 | 38.8 | 39.6 | 39.2 |
| … are more accessible | 39.9 | 36.0 | 34.3 | 33.7 | 32.7 |
| … handle problems effectively | 25.2 | 24.2 | 22.5 | 23.2 | 21.9 |
| ... collaborate well with residents | 22.3 | 20.0 | 19.3 | 20.4 | 20.1 |
| … have little contact with residents | 43.4 | 48.5 | 51.3 | 52.9 | 55.9 |
| ... issue too few fines | 28.3 | 30.8 | 30.3 | 27.7 | 28.9 |
Sources
- Publication - 2025 Safety Monitor (in Dutch)
Related items
- News release - Number of people who feel unsafe is rising
- News release - No change in incidence of theft and violent crime