4. Optimal grid resolution for river plumes
In the previous report, we primarily focused on the SNS assessment area to determine the optimal grid resolution for calculating growing season means and concomitant confidence ratings. Here, we revisit the smaller assessment areas, i.e. river plumes, along the Dutch coast in more detail to determine whether aggregation of chl-a on a 10×10 km scale is indeed optimal for the assessment procedure. We applied the proposed assessment method for the RHPM, MPM, SCHPM1 (Scheldt plume 1), and SCHPM2 (Scheldt plume 2) assessment areas, using three different grid resolutions, 10×10, 5×5 and 2×2 km, and evaluated the results.
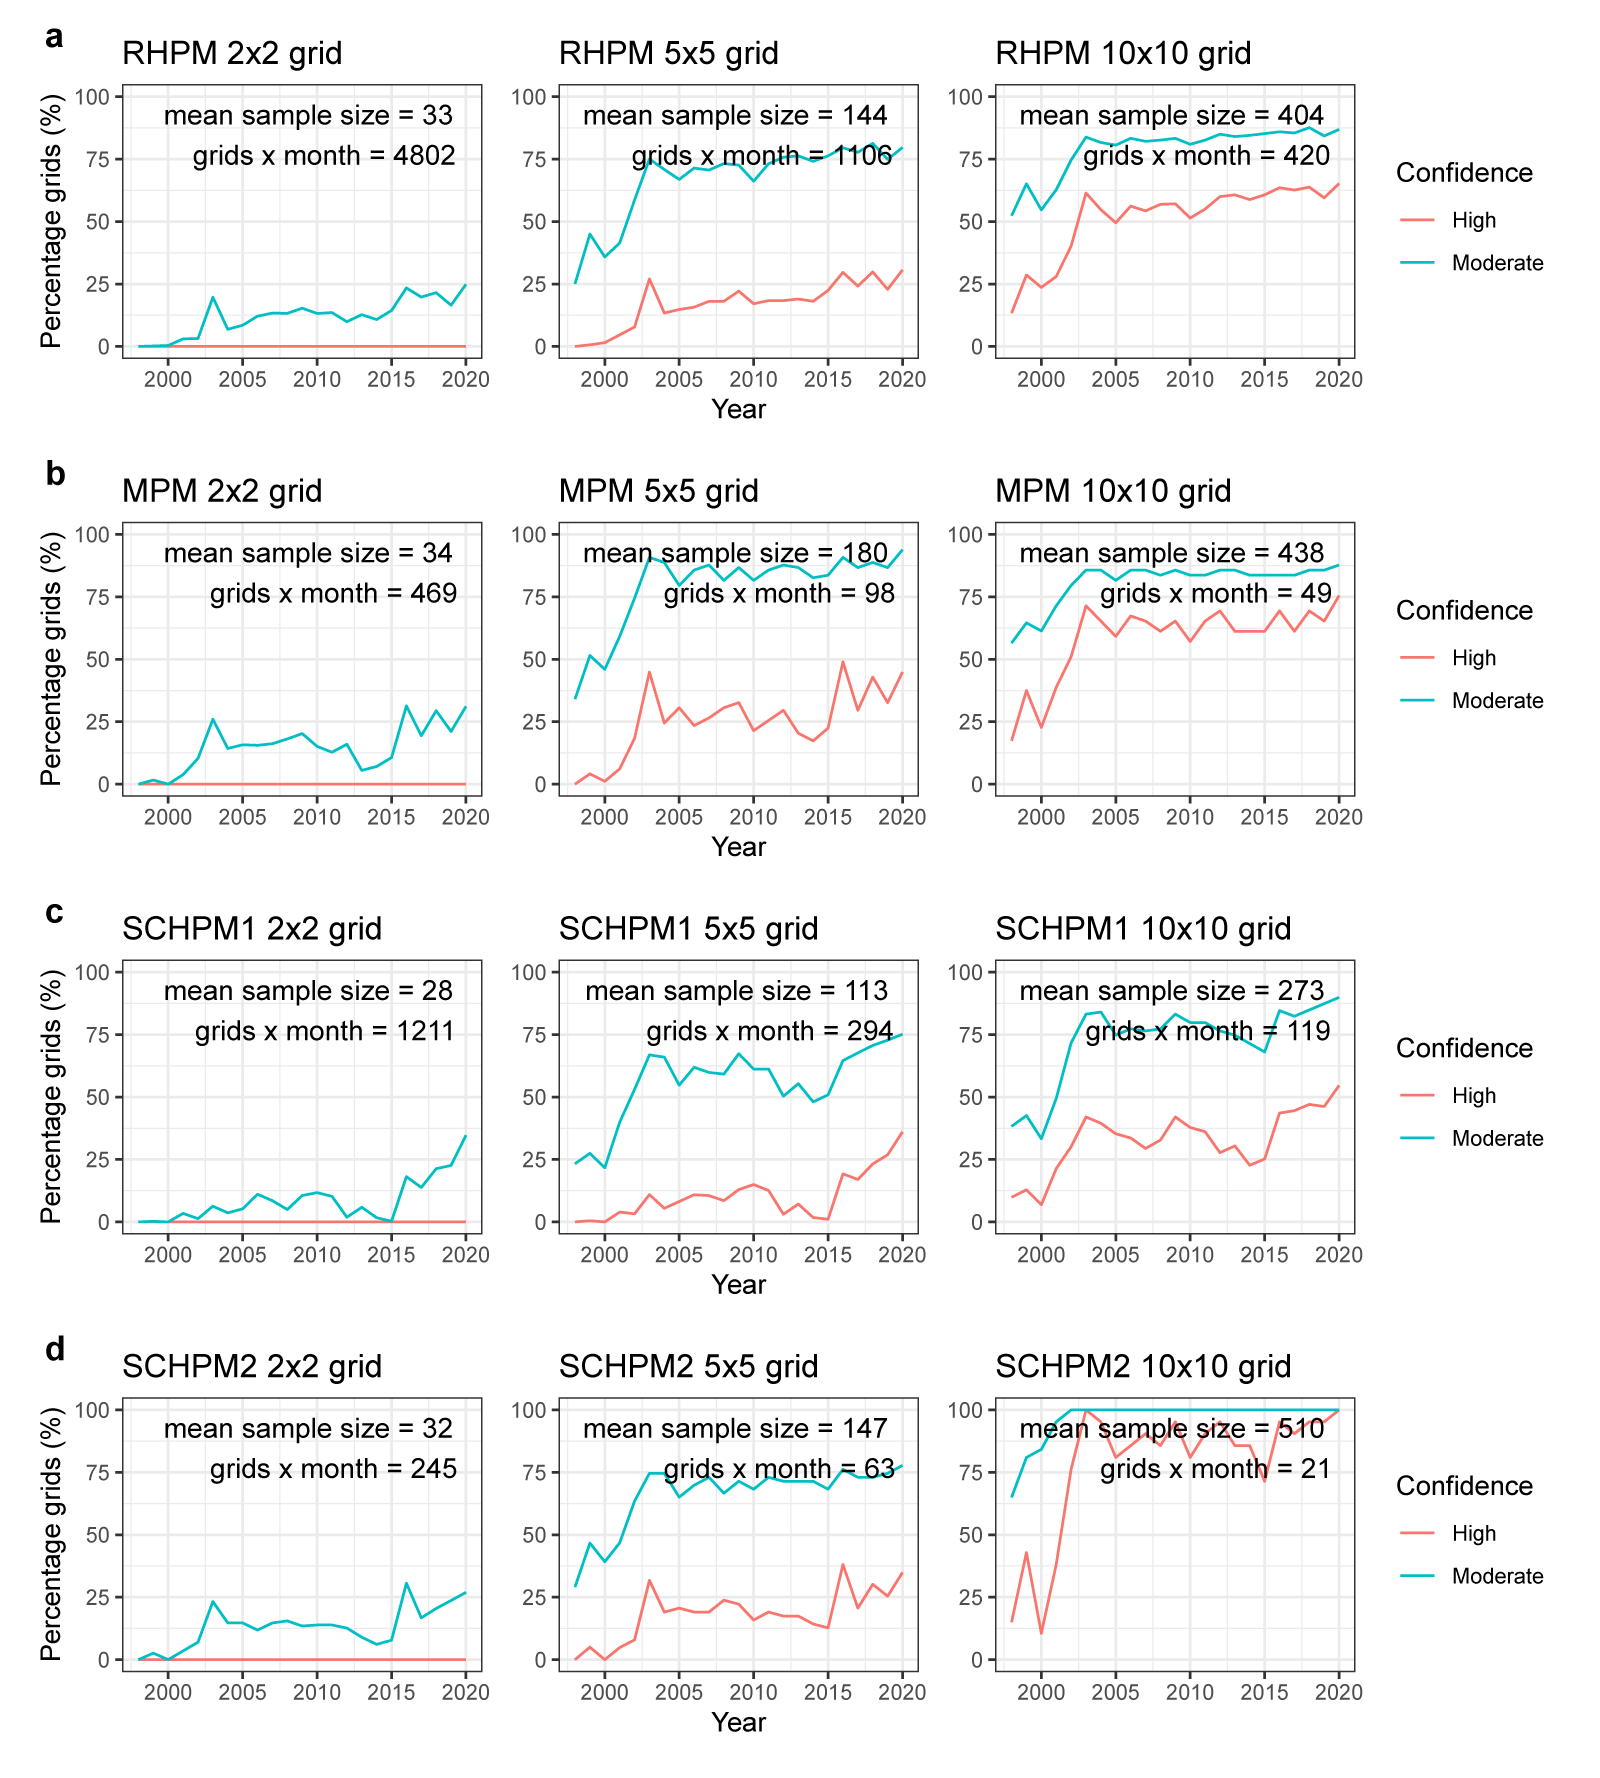
As grid size increases, more chl-a measurements are included in each year-month-grid aggregation. This leads to a general increase in confidence ratings, as a higher proportion of grid cells meets the thresholds for moderate (>60 samples) and high (>260 samples) confidence (Figure 5). Additionally, advances in satellite sensors and data processing algorithms have led to a higher proportion of grid cells reaching these confidence thresholds over the course of the study period.
The downside of using a coarser grid is that it reduces the number of distinct spatial units within an assessment area, thereby lowering the total number of grid-month combinations available for calculating growing season means (Figure 5). The number of months per growing season (seven) remains the same across all grid resolutions, but finer grids provide a more spatially detailed representation of the assessment area. This trade-off between spatial resolution and confidence should also be considered when selecting the appropriate grid size for each assessment area.
The COMP4 assessment was repeated for the four assessment areas at varying spatial grid resolutions (Table 2), using area-specific threshold values (TVs). Mean growing season chl-a concentrations were generally consistent across grid resolutions, with the largest observed difference being 0.6 µg L⁻¹ between the 5×5 km and 10×10 km grids in the MPM area. This difference translated into a 0.04 change in EQRS.
Although these differences appear minor, they can still substantially influence the assigned eutrophication status because the method does not account for uncertainty. For example, both MPM and SCHPM2 shifted from Moderate to Poor status when moving from the 5×5 km to the 10×10 km grid. In the proposed method, the confidence rating (Moderate for 5×5 km and High for 10×10 km) reflects the uncertainty range around the mean. For MPM, the uncertainty was between 0.49 and 0.97 µg L⁻¹ at 5×5 km, and below 0.52 µg L⁻¹ at 10×10 km. For SCHPM2, uncertainty ranged from 0.56 to 1.11 µg L⁻¹ at 5×5 km and was below 0.58 µg L⁻¹ at 10×10 km. When this uncertainty is incorporated into the assessment, all grid resolutions for these areas yield the same eutrophication status, on the boundary between Moderate and Poor.
However, coarser grids reduce spatial detail, potentially masking local variation or ecologically relevant gradients. Both SCHPM2 and MPM are relatively small areas (95 km² and 205 km², respectively), corresponding to only 3–7 grid cells at 10×10 km resolution. Few formal guidelines exist on the minimum number of grid cells required to capture local variability meaningfully, as this depends on the spatial homogeneity of the area and the environmental parameter assessed.
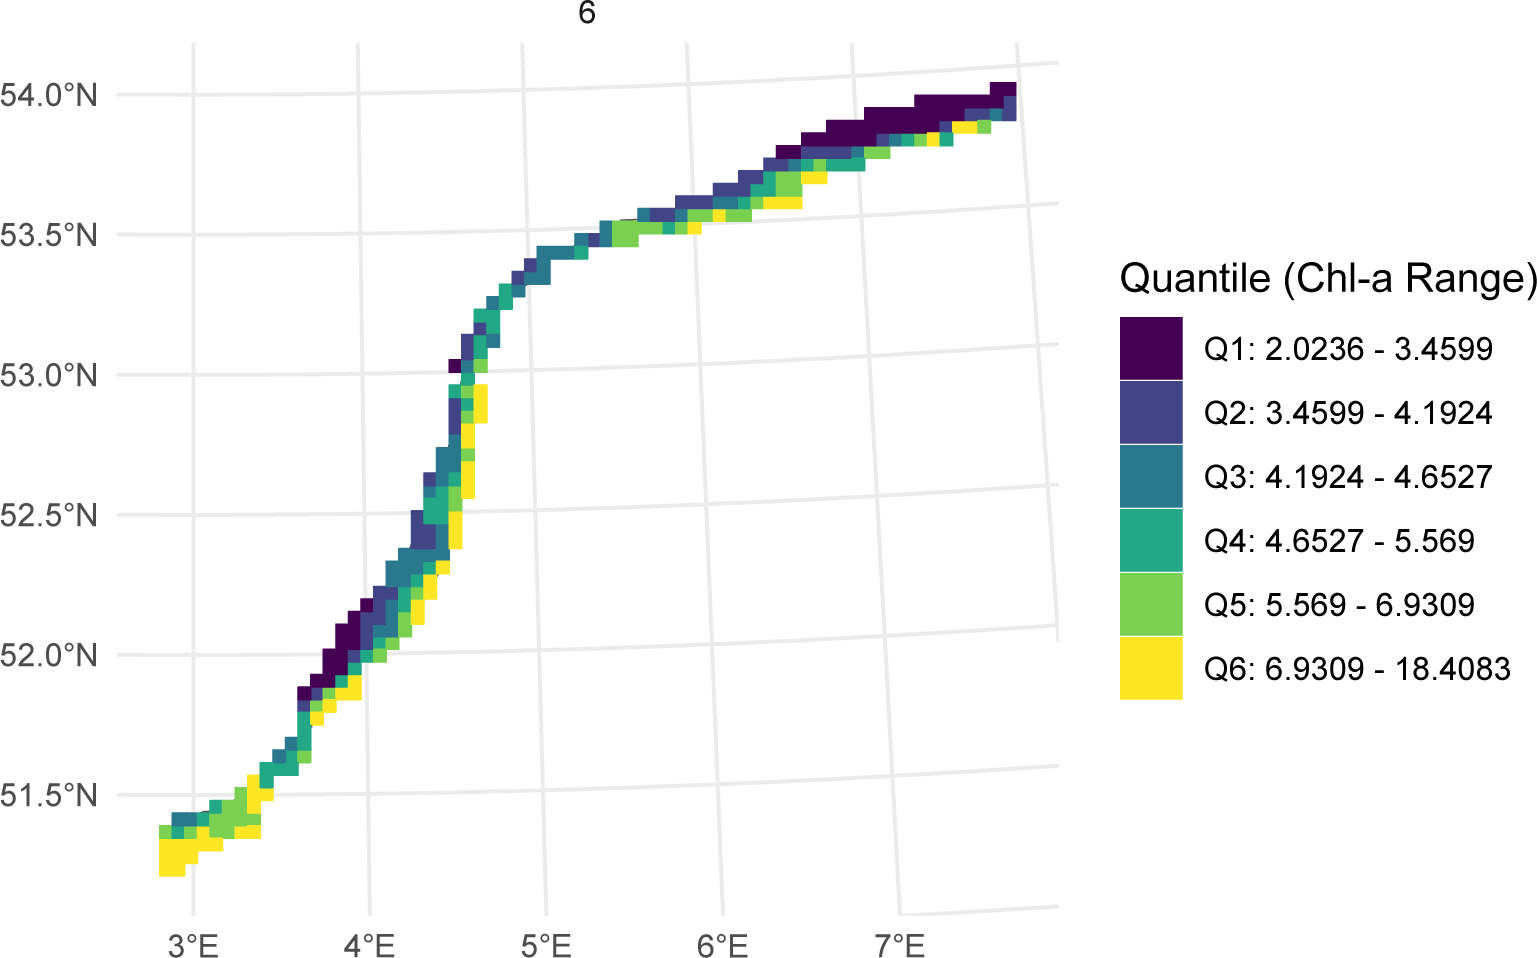
The OSPAR assessment areas were delineated to represent relatively homogeneous regions, implying broadly similar chl-a concentrations within each. Nevertheless, spatial gradients can still occur, as illustrated in Figure 6, which shows chl-a distribution across the Dutch river plume assessment areas in June 2020.
Although such gradients are not explicitly used in this assessment, setting a minimum threshold for the number of grid cells per assessment area, on which to base the growing-season mean, could be advisable and is ultimately a policy decision. For smaller areas such as MPM and SCHPM2, a finer grid resolution (5×5 km) may be preferable, provided that at least a Moderate confidence rating can be achieved. This approach maintains a balance between statistical reliability and spatial resolution.
Figure 5. Percentage of grids in the a) RHPM, b) MPM, c) SCHPM1, and d) SCHPM2 assessment areas with a confidence rating of at least High (> 260 measurements) or at least Moderate (> 60 measurements) from 1998 until 2020 for three different grid resolutions. In the graphs, the mean sample size per year-month-grid combination is indicated, as well as the maximum number of grid-month combinations per growing season.
| Area | Period | Grid resolution (km) | TV | Chl-a (ug/L) | EQRS | Status | Confidence rating |
|---|---|---|---|---|---|---|---|
| MPM | 2015-2020 | 2x2 | 8 | 10,0 | 0,41 | Moderate | Low |
| MPM | 2015-2020 | 5x5 | 8 | 9,7 | 0,43 | Moderate | Moderate |
| MPM | 2015-2020 | 10x10 | 8 | 10,3 | 0,39 | Poor | High |
| RHPM | 2015-2020 | 2x2 | 6,8 | 7,0 | 0,57 | Moderate | Low |
| RHPM | 2015-2020 | 5x5 | 6,8 | 7,2 | 0,55 | Moderate | Moderate |
| RHPM | 2015-2020 | 10x10 | 6,8 | 7,3 | 0,53 | Moderate | Moderate |
| SCHPM1 | 2015-2020 | 2x2 | 5 | 12,4 | 0,14 | Bad | Low |
| SCHPM1 | 2015-2020 | 5x5 | 5 | 12,4 | 0,14 | Bad | Moderate |
| SCHPM1 | 2015-2020 | 10x10 | 5 | 12,1 | 0,14 | Bad | Moderate |
| SCHPM2 | 2015-2020 | 2x2 | 8,9 | 11,1 | 0,41 | Moderate | Low |
| SCHPM2 | 2015-2020 | 5x5 | 8,9 | 11,1 | 0,41 | Moderate | Moderate |
| SCHPM2 | 2015-2020 | 10x10 | 8,9 | 11,5 | 0,39 | Poor | High |
Figure 6. Quantile chlorophyll-a concentrations (μg L<sup>-1</sup>) summarized on a 5×5 km scale in the RHPM, MPM, SCHPM1, and SCHPM2 assessment area’s in June 2020.
If these changes are applied to Table 1 from Section 3, the eutrophication status and the confidence rating for MPM will shift from Poor to Moderate and High to Moderate, respectively (Table 3). Notably, the mean growing season chl-a concentration under the proposed method is lower than the value reported by the applied method on COMPEAT. This difference is primarily due to the disproportionate influence of the in-situ data in this assessment area in the reported OSPAR method. Only one in-situ monitoring site is sampled throughout all months of the growing season, yet it is weighted equally (50%) relative to the EO data, which leads to an overrepresentation of that single in-situ signal in the final result.
The results for SCHPM1 and SCHPM2 under the proposed method are largely consistent with those reported on COMPEAT. For SCHPM2, no in-situ monitoring sites are present, so both the applied method and the proposed method rely solely on EO data. SCHPM1 has a single in-situ monitoring site, similar to MPM; in this case, however, the in-situ values align more closely with the mean chl-a concentrations based on EO data and weighting them equally does not lead to a different eutrophication status.
| Applied method | Proposed method | |||||||||
|---|---|---|---|---|---|---|---|---|---|---|
| Area | Period | TV | Chl-a (ug/L) | EQRS | Status | Confidence rating | Chl-a (ug/L) | EQRS | Status | Confidence rating |
| MPM | 2015-2020 | 8 | 11,9 | 0,32 | Poor | High | 9,7 | 0,43 | Moderate | Moderate |
| SCHPM2 | 2015-2020 | 8,9 | 11,0 | 0,43 | Moderate | High | 11,1 | 0,41 | Moderate | Moderate |
| SCHPM1 | 2015-2020 | 5 | 12,2 | 0,15 | Bad | High | 12,1 | 0,14 | Bad | Moderate |
| RHPM | 2015-2020 | 6,8 | 7,6 | 0,53 | Moderate | High | 7,3 | 0,53 | Moderate | Moderate |
| SNS | 2015-2020 | 3,8 | 3,3 | 0,74 | Good | High | 3,0 | 0,83 | High | High |
4.1 Conclusion
The assessment of smaller Dutch OSPAR areas using different spatial grid resolutions showed that mean growing-season chl-a concentrations and EQRS values were largely consistent across grid sizes. Although coarser grids (10×10 km) increased statistical confidence by incorporating more samples per cell, they also reduced spatial detail, as the mean was based on fewer spatial grids per assessment area. In the smallest areas, such as MPM and SCHPM2, growing-season means were derived from only 3 – 7 grid cells in the 10×10 layout.
Nevertheless, the overall differences in mean chl-a concentrations and EQRS values between grid resolutions were minimal, suggesting that all tested grid sizes yield comparable assessment outcomes when uncertainty around the mean is considered. For small river plumes, a finer grid resolution (5×5 km) may still be preferred, provided that at least a Moderate confidence rating can be achieved, as it better preserves spatial gradients while maintaining sufficient statistical reliability.