3. COMP4 assessment
In the OSPAR Common Procedure Eutrophication Assessment Tool (COMPEAT), the eutrophication status for each indicator, including chl-a, is classified on a scale from ‘Bad’ to ‘High3). This classification is based on indicator-specific thresholds defined for each OSPAR assessment area and scaled using the Ecological Quality Ratio Scaled (EQRS) approach4). Assessment results are reported for the growing season (March to September) and for defined assessment periods, spanning six years.
The fourth application of the Common Procedure (COMP4) covered the period 2015–2020. In this chapter, we repeated the COMP4 assessment for the SNS, MPM, and RHPM assessment areas using the newly proposed method, to evaluate whether it leads to different classification outcomes.
In Table 1, an overview of the results for the COMP4 per assessment area (including threshold value; TV, and differences in confidence rating) is given by comparing the assessment applied by OSPAR, weighting EO and in-situ chl-a seasonal means equally, and the improved method, which first aggregates EO and in-situ chl-a data on a 10×10 km scale per month and year before calculating growing season means and confidence ratings. The down-weighting of in-situ data according the confidence rating was not applied on COMPEAT, see annex I for the results in these assessment areas according to the agreed method (70:30 weighting for EO to in-situ data in MPM; although no shifts in status occurred).
| Applied method | Proposed method | |||||||||
|---|---|---|---|---|---|---|---|---|---|---|
| Area | Period | TV | Chl-a (ug/L) | EQRS | Status | Confidence rating | Chl-a (ug/L) | EQRS | Status | Confidence rating |
| MPM | 2015-2020 | 8 | 11,9 | 0,32 | Poor | High | 10,3 | 0,39 | Poor* | High* |
| RHPM | 2015-2020 | 6,8 | 7,6 | 0,53 | Moderate | High | 7,3 | 0,53 | Moderate | Moderate |
| SNS | 2015-2020 | 3,8 | 3,3 | 0,74 | Good | High | 3,0 | 0,83 | High | High |
| *See chapter 4 | ||||||||||
In the proposed method, mean growing season chl-a concentrations are generally lower than those reported by the applied method. This is likely due to the reduced influence of in-situ data, which tend to be more affected by extreme chl-a values because of the smaller sample size and more sporadic sampling, compared to the EO data. Due to the large amount of data, satellite data therefore exhibits a smoothing effect across the grid cells for the assessment area compared to the sporadic in-situ data, which can randomly capture algal blooms. For this reason, it is necessary to review and possibly adjust the associated chl-a threshold values.
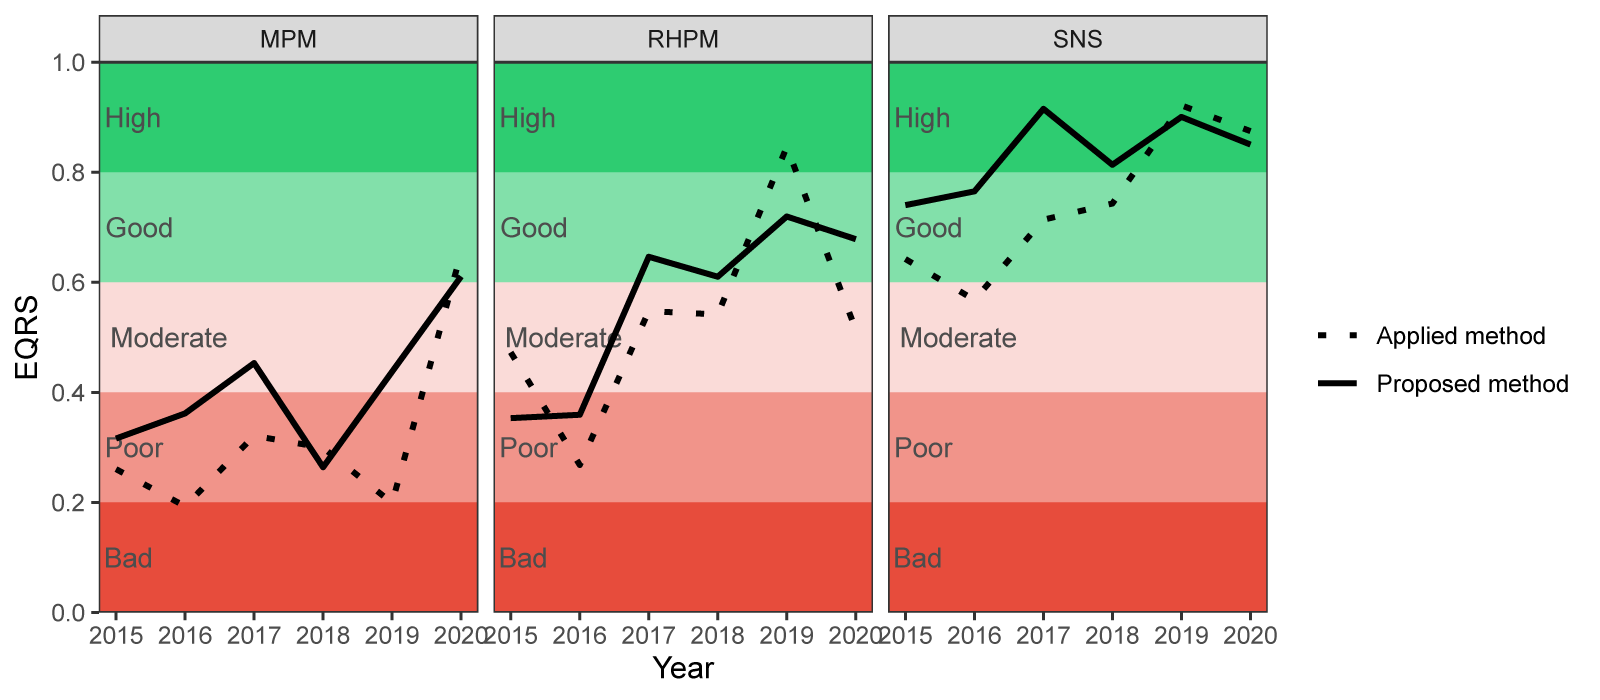
This reduced influence of in-situ data leads to a higher EQRS and a more positive status. For example, the status for SNS increased from Good to High. Differences in EQRS per year for COMP4 are shown in Figure 4. As mentioned before, EQRS values are generally higher in the proposed method, show less variation between the years, and have a different status in some years.
Figure 4. EQRS per OSPAR assessment area between 2015-2020 as applied in COMP4 and according to the proposed method.
In addition to differences in mean growing season chl-a concentrations, a newly proposed method for inferring confidence rating based on sample size was also introduced. The current method used by OSPAR for assigning a confidence rating is the same for in-situ and EO data, and the criteria lack a formal statistical foundation (for details, see Annex 13 of the OSPAR eutrophication status assessment procedure)4). The novel method uses the sample size from each year–month–grid combination, which is then aggregated to derive an overall confidence rating for the chl-a growing season mean each year. Confidence classes are derived using the relative margin of error (MOE; which quantifies the amount of random sampling error, for details see section 4.4 of the previous report)1). The classes are defined as follows: ‘Low’ confidence corresponds to an error range > 10% and a sample size < 50 or 60 (SNS or coastal zone), ‘Moderate’ to an error range between 10% and 5% and sample sizes between 50 and 200 or 60 and 260 (SNS or coastal zone), and ‘High’ to an error range < 5% and a sample size > 200 or 260 (SNS or coastal zone). Sample sizes required to reach a certain error range were determined per assessment area following the approach from the previous report, as each area exhibits different chl-a concentrations and fluctuation patterns.
It should be noted that the error ranges of 10% and 5% were coined in the previous report as more objective boundaries for determining the confidence ratings, but these can be adjusted to the accepted error range, which is up to policy, and can also be area specific.
This leads to differences in the overall confidence rating for COMP4, where RHPM scored Moderate instead of High based on the stricter, but more statistically founded method. This was expected, as the criteria for determining the confidence rating used in the applied method were based on the in-situ data alone.
3.1 Conclusion
Applying the proposed method to the COMP4 assessment for the SNS, MPM, and RHPM areas resulted in generally lower mean growing season chl-a concentrations compared to the results published on COMPEAT. This difference is mainly due to the reduced influence of in-situ data, which are more prone to extreme values because of their limited and irregular sampling frequency. As a result, the proposed method produced higher EQRS values and, in some cases, a more favorable eutrophication status (e.g., from Good to High in the SNS).
The proposed approach for deriving confidence ratings, which explicitly accounts for sample size and statistical uncertainty, led to more differentiated and statistically grounded confidence classes. While this method resulted in lower confidence ratings for some assessment areas (e.g., RHPM), it provides a more robust and transparent basis for interpreting chl-a assessment outcomes within COMPEAT.