Society
The society in which we live and how this society functions have an important impact on our quality of life. Here we look at how Dutch society functions in terms of participation and trust, two fundaments of social cohesion. Trust is important for people individually, but also for social fabric as a whole. For the individual, trust contributes to a higher level of well-being, because being surrounded by people and institutions we trust makes life easier. For society as a whole, trust means that people are more inclined to cooperate with each other and to help other people when required (OECD, 2017a). For more information about participation and trust in the Netherlands, see Schmeets (2018), CBS (2019d) and Schmeets and Exel (2020).
Voluntary work
Trust in other people
Trust in institutions
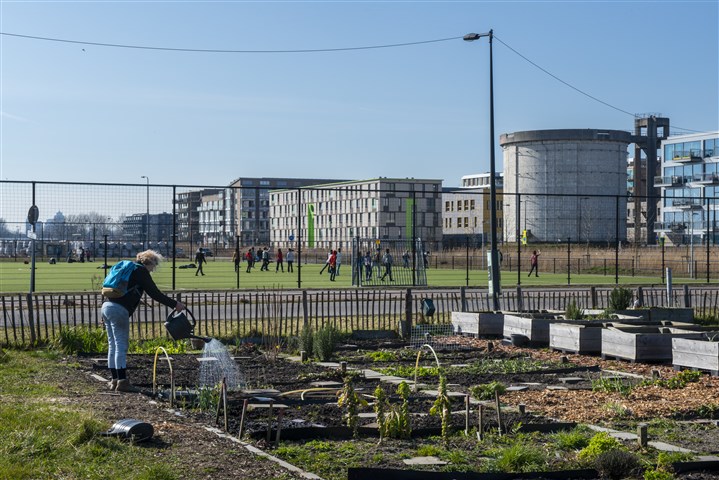
Voluntary work
Situation in 2022
In 2022, 41.2 percent of the Dutch population aged 15 years and older reported they had done some form of voluntary work at least once for an organisation, club or association during the previous year. As in previous years, most voluntary work is done at sports clubs and schools (Schmeets and Arends, 2020).
- People aged 25 to 34 years and 75 years and older do less voluntary work than average (34.2 percent and 34.5 percent respectively). People aged 35 to 54 years and 65 to 74 years do more than average, on the other hand (44.6 percent and 48.4 percent respectively) Higher educated people do more voluntary work than average (51.9 percent), whereas those with lower education levels do so less than average (31.2 percent).
- Relatively more people born in the Netherlands with parents born in the Netherlands do voluntary work (44.7 percent). For people born in the Netherlands with at least one parent born outside the Netherlands, and even more so for the group born outside the Netherlands, percentages doing voluntary work are below average.
Sex, age, education level and origin/country of birth may correlate with each other. The percentage of people with higher education, for example, is not the same in all age groups. For the measurements conducted in this analysis, these relations are taken into account by applying a standardisation procedure, which corrects for the variation in the occurrence of the above characteristics. On the basis of standardised figures on voluntary work, the above findings largely remain intact, however:
- If a correction is applied to the group aged 15 to 24 years for differences in composition by sex, education level and origin/country of birth compared with other age groups, this group turns out to do more voluntary work than average. This difference is not visible in the uncorrected figures because the group aged 15 to 24 years includes a relatively large number of people with a low education level (because they have not yet completed their education) and people born outside the Netherlands or with parents born outside the Netherlands; relatively few people in these three groups do voluntary work.
- If we apply a similar correction to the groups aged 35 to 54 years, they turn out to have average rates of voluntary work. The above average percentages in the non-standardised figures are caused by the relatively high share of people with high education levels in these age groups.
Changes between 2019 and 2022
The total share of people saying they did voluntary work in 2022 was 5.5 percentage points lower than in 2019. Compared with this average decrease for the overall population, the decrease among women was larger than the decrease for men between 2019 and 2022. As a result, the total share of voluntary workers is around the same for men and women in 2022. The share of 35- to 44-year-olds who reported doing voluntary work also fell relatively sharply. For the over-65s there was no decrease, the share in this group rose. Lastly, the decrease in the number of people doing voluntary was relatively large for people with medium levels of education.
Trust in other people
Situation in 2022
Around two-thirds of the Dutch population aged 15 years and older in 2022 trusted other people, while the remainder believed you can never be too careful in relations with other people.
- Men are more likely than women to trust other people: 68.4 versus 63.6 percent.
- Fewer than average people aged 75 years and older (55.8 percent) and 15- to 24-year-olds (61.5 percent) trust other people. People aged between 25 and 54 years, on the other hand, have higher than average levels of trust in other people.
- Higher educated people are more likely than average to trust others: 84.1 percent. By contrast, people with medium (64.5 percent) and especially those with low levels of education (46.7 percent) are below average in terms of trusting other people.
- People born in the Netherlands with parents born in the Netherlands are relatively more likely to trust other people (69.6 percent). People born in the Netherlands with at least one parent born outside Europe and the group who were themselves born outside Europe have the lowest levels of trust in other people. Migrants born in Europe also have lower than average levels of trust in others.
The characteristics sex, age, education level and origin/country of birth correlate with each other. The percentage of higher educated people, for example, is not the same in all age groups. This is taken into account by standardising the figures, correcting for the variation in the occurrence of the above characteristics. On the basis of standardised figures on trust in other people, the results described above change for some age groups:
Correction for the different composition by sex, education level and origin/country of birth in each age group shows that people aged 15 to 24 years have an average level of trust in other people. The uncorrected figures show a below average level of trust because this age group includes a relatively large number of people with a low education level (because they have not yet completed their education), and people who were born, or whose parents were born, outside Europe; and these three groups have relatively low levels of trust in others.
On the basis of the corrected figures, people aged 25 to 54 years no longer have higher than average levels of trust in other people: this age group includes a relatively large number of higher educated people, who are more likely to trust others.
Changes between 2019 and 2022
The total share of people saying they trust other people is 4.2 percentage points higher in 2022 than in 2019. Compared with this change for the population as a whole, no single group showed substantially different developments.
Trust in institutions
Situation in 2022
Trust in institutions is measured by asking people how much they trust the police, the courts and the House of Representatives. On average, 61.3 percent of people aged 15 years and older trusted these three institutions in 2022. This is not the percentage of people who trust all three institutions, but the average across the three institutions. Trust in the police and the courts was highest at 77.0 and 76.7 percent respectively. Trust in the House of Representatives was markedly lower at 30.4 percent. Further information on trust in institutions can be found on StatLine (CBS, 2022).
- Men (60.5 percent) trust institutions less than women (62.1 percent).
- Older people place less trust in institutions than younger people: in age groups over 55 years trust in institutions was below average. On the other hand, 15- to 24-year-olds (67.7 percent) and 35- to 44-year-olds (64.8 percent) trusted institutions more than average.
- Higher educated people are more likely than average to trust institutions (69.6 percent). Groups with medium and lower education levels are less likely to trust them.
- People born in the Netherlands with at least one parent born outside Europe have a below average level of trust in institutions, at 57.5 percent.
The characteristics sex, age, education level and origin/country of birth correlate with each other. The percentage of highly educated people, for example, is not the same in all age groups. This is taken into account by standardising the figures, correcting for the variation in the occurrence of the above characteristics. On the basis of standardised figures on trust in institutions the above-mentioned results change as follows:
- If we correct the age groups for unequal composition by sex, education level and origin/country of birth, men and women turn out to have a similar level of trust in institutions.
- If we correct the age groups for unequal composition by sex, education level and origin/country of birth, it turns out that 35- to 44-year-olds no longer have a higher than average level of trust and the over-75s no longer have a lower than average level of trust in institutions. In the latter group, one reason for this is that it comprises relatively many people with lower education levels, which push the level of trust in institutions down in the non-standardised figures.
Changes between 2019 and 2022
Following a few years with relatively high levels of trust in institutions – during the coronavirus pandemic – the total number of people who trust institutions dropped again in 2022. It was 1.8 percentage points lower in 2022 than in 2019.
Compared with this decrease for the population as a whole:
- The group aged 25 to 34 years showed an even larger decease in trust.
- Trust in institutions rose among the over-65s.
- The group with lower education levels reported a slightly higher level of trust in institutions.
- Trust in institutions fell relatively sharply, by 4.5 percentage points, for the group with higher levels of education.
References
OECD, 2017a, OECD Guidelines on Measuring Trust. OECD Publishing, Parijs.
Schmeets, H., 2018, Participatie op de kaart. Statistische Trends, Centraal Bureau voor de Statistiek, The Hague/Heerlen/Bonaire.
CBS, 2019d, Vertrouwen in Europa en politiek stijgt. Centraal Bureau voor de Statistiek, The Hague /Heerlen/Bonaire.
Schmeets, H., and J. Exel (2020). Vertrouwen, maatschappelijk onbehagen en pessimisme. CBS, statistische trends. Centraal Bureau voor de Statistiek, The Hague /Heerlen/Bonaire.
Schmeets, H. and J. Arends, 2020, Vrijwilligerswerk en welzijn. Statistische Trends, Centraal Bureau voor de Statistiek, The Hague /Heerlen/Bonaire.
CBS, 2022, Vertrouwen in mensen en in organisaties; persoonskenmerken. Centraal Bureau voor de Statistiek, The Hague /Heerlen/Bonaire.