More traffic deaths in 2022, particularly among cyclists over 75
Last year, the number of road traffic fatalities was nearly 27 percent higher than in 2021. Just as in previous years, there were more male (522) than female victims (215).
| Jaar | Total | Men | Women |
|---|---|---|---|
| 2000 | 1166 | 861 | 305 |
| 2001 | 1083 | 816 | 267 |
| 2002 | 1066 | 790 | 276 |
| 2003 | 1088 | 804 | 284 |
| 2004 | 881 | 630 | 251 |
| 2005 | 817 | 594 | 223 |
| 2006 | 811 | 576 | 235 |
| 2007 | 791 | 574 | 217 |
| 2008 | 750 | 552 | 198 |
| 2009 | 720 | 524 | 196 |
| 2010 | 640 | 475 | 165 |
| 2011 | 661 | 477 | 184 |
| 2012 | 650 | 479 | 171 |
| 2013 | 570 | 419 | 151 |
| 2014 | 570 | 411 | 159 |
| 2015 | 621 | 458 | 163 |
| 2016 | 629 | 458 | 171 |
| 2017 | 613 | 453 | 160 |
| 2018 | 678 | 485 | 193 |
| 2019 | 661 | 465 | 196 |
| 2020 | 610 | 453 | 157 |
| 2021 | 582 | 427 | 155 |
| 2022* | 737 | 522 | 215 |
| * Provisional figures | |||
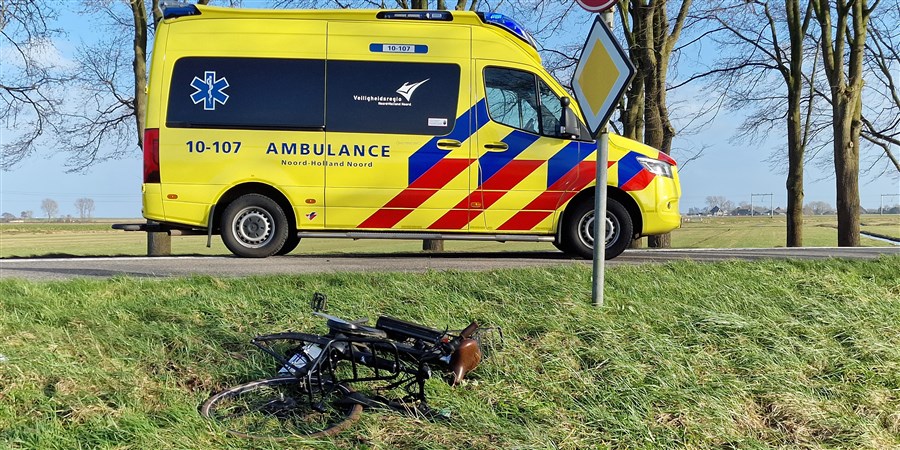
Highest cyclist death toll in 27 years
In 2022, traffic accidents killed 291 cyclists. This is 84 more than in the previous year and the highest number of cycling deaths since 1996 (when registration started). In addition, 225 passenger car occupants were killed, i.e. 50 more than in 2021.
| Jaar | Bicycle | Passenger car |
|---|---|---|
| 1996 | 239 | 609 |
| 1997 | 264 | 591 |
| 1998 | 212 | 603 |
| 1999 | 227 | 587 |
| 2000 | 233 | 543 |
| 2001 | 225 | 504 |
| 2002 | 195 | 503 |
| 2003 | 219 | 496 |
| 2004 | 180 | 420 |
| 2005 | 181 | 356 |
| 2006 | 216 | 340 |
| 2007 | 189 | 317 |
| 2008 | 181 | 317 |
| 2009 | 185 | 296 |
| 2010 | 162 | 246 |
| 2011 | 200 | 231 |
| 2012 | 200 | 232 |
| 2013 | 184 | 193 |
| 2014 | 185 | 187 |
| 2015 | 185 | 224 |
| 2016 | 189 | 231 |
| 2017 | 206 | 201 |
| 2018 | 228 | 233 |
| 2019 | 203 | 237 |
| 2020 | 229 | 195 |
| 2021 | 207 | 175 |
| 2022* | 291 | 225 |
| * Provisional figures | ||
Sharpest rise in road fatalities among over-75s
Traffic mortality rose most sharply among people aged 75 and over, by 59 percent relative to 2021. This is mainly due to more road fatalities among cyclists in this age group: 150 in 2022, up from 94 in the previous year. Traffic victims aged 50 years and over are relatively likely to be involved in a bicycle accident, while younger victims (under 50) are more likely to be killed in a car accident. In relative terms as well, the number of senior cyclists involved in a fatal road accident increased.
| Leeftijd | Under 25 yrs (%) | 25-49 yrs (%) | 50-74 yrs (%) | 75 yrs and over (%) |
|---|---|---|---|---|
| Total | 111 | 148 | 210 | 268 |
| Bicycle | 26 | 18 | 97 | 150 |
| Passenger car | 48 | 86 | 43 | 48 |
| * Provisional figures | ||||
More cycling fatalities due to collision
Of all cycling fatalities in 2022, almost half were caused by a collision with a van or passenger car. This concerned 141 cycling victims, 60 more than in 2021. There were also more cyclists who were killed in a crash with a lorry, bus or another vehicle. One quarter of all bicycle deaths were not due to a collision. These cyclists died after a fall, due to becoming unwell, wrong steering, bad road surface, slipperiness, or a foot between the spokes, among other things. Over two thirds of these victims were 70 years of age or older.
| Jaar | Collision with passenger car/van | Collision with lorry/bus | Collision with another vehicle | Collision with fixed object | No collision | Other collision/unknown |
|---|---|---|---|---|---|---|
| 2022* | 141 | 28 | 37 | 7 | 73 | 5 |
| 2021 | 81 | 24 | 22 | 9 | 71 | 0 |
| * Provisional figures | ||||||
Largest increase in traffic mortality recorded in Noord-Brabant
Noord-Brabant recorded 140 road fatalities, i.e. the highest number of all provinces and 49 more than in 2021. There were far fewer casualties in Drenthe, Overijssel and Zeeland, but the traffic death toll doubled compared to 2021. The province of Utrecht saw a decline, while in Flevoland the number was almost equal to 2021. The lowest number of road fatalities was recorded in Flevoland.
| Provincie | 2022* | 2021 |
|---|---|---|
| Noord-Brabant | 140 | 91 |
| Zuid-Holland | 110 | 94 |
| Gelderland | 103 | 94 |
| Noord-Holland | 93 | 88 |
| Overijssel | 63 | 34 |
| Limburg | 54 | 41 |
| Utrecht | 42 | 47 |
| Drenthe | 38 | 20 |
| Fryslân | 30 | 24 |
| Groningen | 26 | 21 |
| Zeeland | 22 | 11 |
| Flevoland | 16 | 17 |
| * Provisional figures | ||