Agricultural emissions lower than in 1995, no more decline in recent years
Agriculture is a source of different emissions, all of which have developed differently since 1995. Although most emissions were reduced, agricultural output rose by 20 percent. Agricultural greenhouse gas emissions declined up to 2003, but have increased slightly since then. The nitrogen surplus was halved between 1995 and 2008, but has barely declined since then. Emissions of fine particulate matter from stationary sources such as greenhouses and stables fell in 2003 because there was less poultry due to bird flu. Emissions rose again afterwards. Particulate emissions from mobile machinery used on farms has declined by three-quarters since 1995.
| Total production volume (1995 = 100) | Greenhouse gas emissions (1995 = 100) | Nitrogen surplus (1995 = 100) | Phosphorus surplus (1995 = 100) | Particulate emissions - stationary sources (1995 = 100) | Particulate emissions - mobile machinery (1995 = 100) | |
|---|---|---|---|---|---|---|
| 1995 | 100 | 100 | 100 | 100 | 100 | 100 |
| 1996 | 99.3 | 101.5 | 93.6 | 98.3 | ||
| 1997 | 103.1 | 94.6 | 89.7 | 81.7 | ||
| 1998 | 100.8 | 92.2 | 95.1 | 93.3 | ||
| 1999 | 104.8 | 90.1 | 87.3 | 85 | ||
| 2000 | 105.8 | 87.2 | 76 | 75 | 105.3 | 90.1 |
| 2001 | 101.6 | 85.4 | 67.9 | 63.3 | 105.3 | 86.5 |
| 2002 | 101.3 | 80 | 58.2 | 43.3 | 101.8 | 80.9 |
| 2003 | 101.7 | 79.1 | 68.4 | 66.7 | 87.7 | 79.4 |
| 2004 | 106.5 | 79.1 | 62 | 43.3 | 96.5 | 73 |
| 2005 | 106.2 | 79.7 | 59.8 | 50 | 100 | 73 |
| 2006 | 105.8 | 78.5 | 61.2 | 55 | 98.2 | 68.8 |
| 2007 | 108.1 | 80.6 | 56.3 | 36.7 | 105.3 | 65.2 |
| 2008 | 110.6 | 84.2 | 50.1 | 26.7 | 108.8 | 54.6 |
| 2009 | 112.9 | 84.2 | 49.3 | 18.3 | 108.8 | 46.8 |
| 2010 | 113.3 | 89.3 | 48.6 | 36.7 | 110.5 | 45.4 |
| 2011 | 112.6 | 84.8 | 47.4 | 20 | 112.3 | 43.3 |
| 2012 | 112.8 | 83.9 | 46.7 | 10 | 110.5 | 40.4 |
| 2013 | 114.4 | 85.1 | 47.4 | 15 | 112.3 | 39 |
| 2014 | 115.6 | 81.5 | 44.4 | 5 | 112.3 | 39 |
| 2015 | 117.1 | 84.5 | 53.7 | 13.3 | 112.3 | 36.2 |
| 2016 | 119.6 | 84.8 | 52.8 | 15 | 112.3 | 31.9 |
| 2017 | 120.4 | 85.4 | 49 | 6.7 | 110.5 | 29.1 |
| 2018 | 117.9 | 84.8 | 53.9 | 21.7 | 108.8 | 30.5 |
| 2019 | 120 | 84.2 | 46.7 | 13.3 | 107 | 27 |
| 2020 | 119.5 | 83 | 48.5 | 16.7 | 108.8 | 25.5 |
| 2021 | 119.6 | 83.3 | 46.1 | 6.7 | 107 | 23.4 |
Most ammonia emissions from farming
In 2020, the value added of agriculture amounted to 1 percent of gross domestic product (GDP). This was still 3 percent in 1995. Agriculture makes a relatively large contribution to emissions; in particular to nitrogen emissions, which become airborne in the form of ammonia. In 2020, agriculture was responsible for over 80 percent of total ammonia emissions by Dutch enterprises and households. In 1995, this share amounted to 91 percent. In both 1995 and 2020, agriculture accounted for 12 percent of all GHG emissions. Currently contributing 7 percent to particulate emissions, this share was actually lower in 1995 (4 percent).
| 1995 (% relative to the Dutch economy) | 2020 (% relative to the Dutch economy) | |
|---|---|---|
| Share in GDP | ||
| Value added | 3 | 1 |
| Share in emissions | ||
| Greenhouse gases | 12 | 12 |
| Nitrogen oxides | 8 | 9 |
| Ammonia | 91 | 84 |
| Fine particulate matter¹⁾ | 4 | 7 |
| 1) For particulate emissions, the share held by agriculture is determined based on the NEC method. | ||
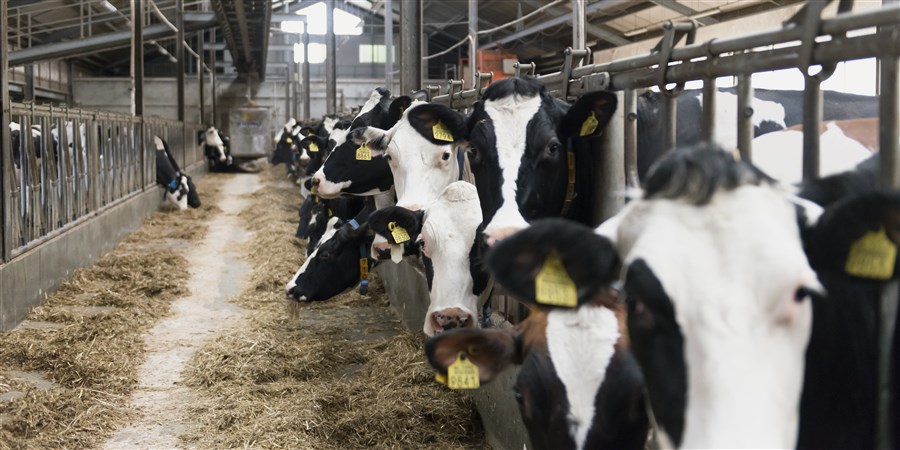
Dairy farming produces the highest GHG emissions
Emissions from agriculture vary per activity. Dairy farming accounts for the bulk of greenhouse gas emissions (36 percent in 2020). Cattle emit the greenhouse gas methane. The dairy sector also emits most of the ammonia and nitrogen oxides. Compared to the share of livestock farming in the value added, these are relatively high emission levels.
The greenhouse horticulture sector also makes a large contribution to greenhouse gases. This is mainly on account of the cogeneration (CHP) systems, which use natural gas. Part of the generated electricity is fed to the public grid. The share of horticulture in the value added of agriculture is half of the total.
Most of the particulates are emitted by agricultural machinery (37 percent) and poultry farms (25 percent) with their dusty sheds.
CBS studied the development of agriculture after 1995 from an environmental perspective. The results were published in the series Statistical Trends: ‘Making agriculture more sustainable - Part I : production and consumption’ and ‘Making agriculture more sustainable – Part II: emissions’ (Dutch only). The focus is on how consumption and emissions have developed in conjunction with production.
Sources
- Statistical trends - Making agriculture more sustainable - Part I : production and consumption (Dutch only)
- Statistical trends - Making agriculture more sustainable – Part II: emissions (Dutch only)