Agriculture’s consumption unchanged for 25 years, despite higher output
Crop and animal production have both increased since 1995. The growth in crop production was achieved despite the reduced fertiliser consumption. The amount of nitrogen applied to farmland via livestock manure fell by 41 percent up to 2012 and then increased slightly again. Nitrogen supplied through chemical fertilisers fell following a similar pattern. Agriculture’s consumption of non-renewable energy such as natural gas was slightly lower in 2021 than 25 years ago after several peaks and troughs.
| Crop production (1995=100) | Animal production (1995=100) | Nitrogen supplied to farmland through manure (1995=100) | Nitrogen supplied to farmland through fertilisers (1995=100) | Non-renewables consumption (1995=100) | |
|---|---|---|---|---|---|
| 1995 | 100 | 100 | 100 | 100 | 100 |
| 1996 | 98.5 | 100 | 100.4 | 95.9 | 109 |
| 1997 | 104.4 | 101.7 | 96.7 | 98.7 | 93.3 |
| 1998 | 102.4 | 99.2 | 89.1 | 99.2 | 92.5 |
| 1999 | 108.2 | 101.3 | 86 | 94.3 | 89.9 |
| 2000 | 112.3 | 98.8 | 80.9 | 83 | 91.7 |
| 2001 | 108.3 | 94.4 | 77.8 | 72.4 | 89.6 |
| 2002 | 107.7 | 94.3 | 71 | 70.9 | 83.8 |
| 2003 | 110.9 | 91.6 | 70.3 | 70.4 | 84.8 |
| 2004 | 115.1 | 97.2 | 67.4 | 72.9 | 86.8 |
| 2005 | 114.5 | 97.1 | 66.8 | 67.5 | 90.8 |
| 2006 | 113.5 | 97.5 | 66.3 | 69.6 | 83.5 |
| 2007 | 115.4 | 100.2 | 65.8 | 61.9 | 88.8 |
| 2008 | 118.5 | 101.9 | 65 | 57 | 97.3 |
| 2009 | 121.2 | 103.9 | 63 | 54.4 | 97 |
| 2010 | 121 | 104.9 | 63.9 | 52.8 | 114.7 |
| 2011 | 120.3 | 104.2 | 62.7 | 51.5 | 102.8 |
| 2012 | 119.9 | 105.1 | 59.4 | 51.5 | 102.4 |
| 2013 | 120.1 | 108.1 | 61.6 | 55.7 | 100.6 |
| 2014 | 124.3 | 106.1 | 63.6 | 54.9 | 87.9 |
| 2015 | 122.7 | 110.6 | 63.9 | 63.1 | 91.6 |
| 2016 | 122 | 117 | 64.5 | 59.3 | 90.3 |
| 2017 | 125.1 | 115 | 67 | 59.3 | 91 |
| 2018 | 121.6 | 113.3 | 67 | 54.6 | 94.9 |
| 2019 | 123.5 | 115.8 | 64.8 | 55.4 | 93.2 |
| 2020 | 121.7 | 117 | 65 | 56.7 | 90.3 |
| 2021 | 126 | 114.7 | 93.2 |
Higher milk production (partly) thanks to concentrates
The fact that, after 2012, more nitrogen entered farmland via livestock manure is because cows started eating more concentrate feed. In the Netherlands, cows mainly eat grass and silage maize from Dutch soil, supplemented with concentrates. Pigs and poultry mainly eat concentrates. Concentrated feed is made from wheat, maize grain and soya, for example, and is a major source of protein in livestock diets. Nitrogen is a building block of protein; therefore, we refer to it as 'the supply of nitrogen through concentrate feed'. Until about 2002, the supply of nitrogen through concentrate feed to pigs and cattle decreased. Then the supply increased again, but where the increase stagnated in pigs, it increased sharply in cattle after 2012.
The increasing use of concentrate feed in cattle contributed to higher milk production per cow. In 1995, Dutch dairy farmers delivered an average of 6.3 thousand kilograms of milk per cow to dairies. In 2021, this was 8.7 thousand kilograms per cow. Partly as a result, total animal production increased by 15 percent since 1995, despite a shrinking livestock population.
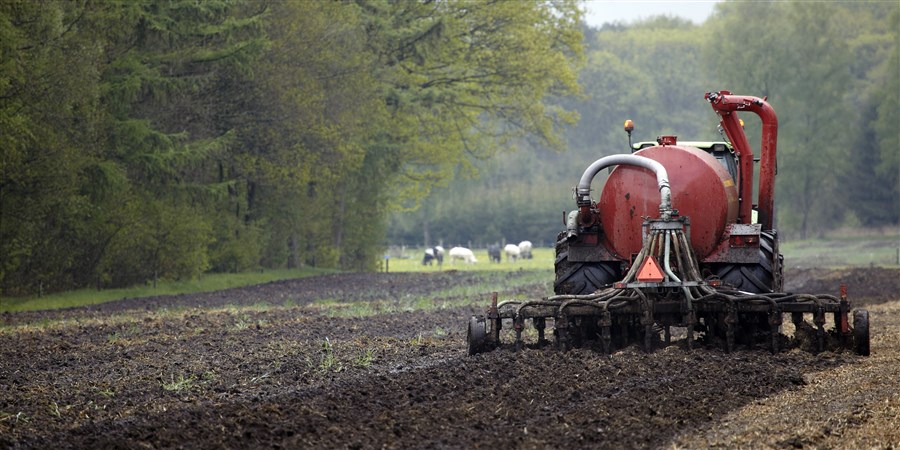
Most of the nitrogen supplied through concentrate feed eventually ends up in animal manure. The supply of nitrogen in animal manure to farmland fell by 41 percent until 2012, before rising again. In 2020, the supply was 35 percent lower than in 1995.
| Supply of nitrogen in livestock concentrates (million kg) | Supply of nitrogen to farmland in animal manure (million kg) | |
|---|---|---|
| 1995 | 485 | 549 |
| 1996 | 472 | 551 |
| 1997 | 447 | 531 |
| 1998 | 444 | 489 |
| 1999 | 442 | 472 |
| 2000 | 422 | 444 |
| 2001 | 399 | 427 |
| 2002 | 382 | 390 |
| 2003 | 349 | 386 |
| 2004 | 361 | 370 |
| 2005 | 375 | 367 |
| 2006 | 372 | 364 |
| 2007 | 377 | 361 |
| 2008 | 398 | 357 |
| 2009 | 397 | 346 |
| 2010 | 404 | 351 |
| 2011 | 399 | 344 |
| 2012 | 385 | 326 |
| 2013 | 396 | 338 |
| 2014 | 406 | 349 |
| 2015 | 414 | 351 |
| 2016 | 429 | 354 |
| 2017 | 425 | 368 |
| 2018 | 410 | 368 |
| 2019 | 400 | 356 |
| 2020 | 406 | 357 |
| Cattle (million kg) | Pigs (million kg) | Poultry (million kg) | |
|---|---|---|---|
| 1995 | 171 | 213 | 101 |
| 1996 | 159 | 212 | 101 |
| 1997 | 145 | 202 | 100 |
| 1998 | 143 | 199 | 102 |
| 1999 | 134 | 199 | 109 |
| 2000 | 130 | 186 | 106 |
| 2001 | 126 | 173 | 100 |
| 2002 | 122 | 156 | 104 |
| 2003 | 123 | 152 | 74 |
| 2004 | 123 | 149 | 89 |
| 2005 | 120 | 158 | 97 |
| 2006 | 118 | 159 | 95 |
| 2007 | 116 | 163 | 98 |
| 2008 | 127 | 169 | 102 |
| 2009 | 124 | 170 | 103 |
| 2010 | 129 | 168 | 107 |
| 2011 | 125 | 170 | 104 |
| 2012 | 120 | 166 | 99 |
| 2013 | 130 | 163 | 103 |
| 2014 | 142 | 160 | 104 |
| 2015 | 144 | 162 | 108 |
| 2016 | 161 | 159 | 109 |
| 2017 | 160 | 160 | 105 |
| 2018 | 153 | 159 | 98 |
| 2019 | 147 | 156 | 97 |
| 2020 | 155 | 154 | 97 |
Natural gas biggest energy expense
An important form of environmentally relevant consumption concerns that of non-renewable energy. In agriculture, this mostly involves natural gas. Greenhouse horticulture consumes the most natural gas. Until 2005, greenhouses were mostly heated by gas-fired boilers and lit by electricity from the grid. Since 2006, more and more horticulturists have been generating their own electricity and heat from natural gas through combined heat and power (CHP). They feed some of this electricity back into the public grid. The non-renewable energy further consumed by agriculture is mainly petroleum, especially as fuel for tractors.
| Natural gas (Petajoules) | Petroleum feedstock and petroleum products (Petajoules) | |
|---|---|---|
| '95 | 139.6 | 18.5 |
| '96 | 154.9 | 17.4 |
| '97 | 131.5 | 16 |
| '98 | 130.2 | 16 |
| '99 | 125.3 | 16.8 |
| '00 | 127.8 | 17.2 |
| '01 | 124.4 | 17.2 |
| '02 | 116.1 | 16.4 |
| '03 | 117.7 | 16.3 |
| '04 | 121.4 | 15.8 |
| '05 | 127.2 | 16.4 |
| '06 | 115.9 | 16.1 |
| '07 | 124.3 | 16.1 |
| '08 | 137.9 | 15.9 |
| '09 | 137.6 | 15.7 |
| '10 | 164.9 | 16.5 |
| '11 | 146.2 | 16.4 |
| '12 | 146.1 | 15.8 |
| '13 | 142.5 | 16.6 |
| '14 | 121.5 | 17.5 |
| '15 | 126.6 | 18.2 |
| '16 | 125.9 | 16.9 |
| '17 | 127.4 | 16.4 |
| '18 | 131.3 | 18.7 |
| '19 | 129.4 | 18 |
| '20** | 124.8 | 18 |
| '21** | 128.6 | 18.7 |
| **revised provisional figures | ||
CBS examined how agriculture has developed from an environmental point of view from 1995 onwards and published it in the article 'The sustainability of agriculture part I: production and consumption', in the Statistical Trends series. The focus is on how environmentally relevant consumption developed in conjunction with production. Environmentally relevant consumption refers to the use of (non-renewable) energy, animal manure and fertilisers, plant protection products, water and feed. The evolution of agricultural emissions will be discussed in a subsequent article.