Environmental sector keeps growing in importance
The environmental sector consists of private enterprises and public entities which produce goods and services aimed at protecting the environment and managing natural resources. Environmental protection activities include for example measurement, prevention and repair of environmental damage caused by air, water and soil pollution. Management of natural resources includes the production of energy-saving and CO2-reducing technologies, products and services, such as the production of renewable energy, electrical transport and insulation work.
The share of the environmental sector in the Dutch economy has grown steadily, from 1.7 percent in 2001 to 2.6 percent in 2021. The share of activities related to natural resource management has doubled over the past two decades. This increase is closely linked to the energy and climate transition. The share held by activities aimed at preserving natural resources showed limited growth in the period 2001-2010, namely 0.2 percentage points.
| Jaar | Environmental protection (% of GDP) | Management of natural resources (% of GDP) | Total environmental sector (% of GDP) |
|---|---|---|---|
| 2001 | 1.13 | 0.52 | |
| 2002 | 1.15 | 0.53 | |
| 2003 | 1.20 | 0.52 | |
| 2004 | 1.16 | 0.53 | |
| 2005 | 1.11 | 0.55 | |
| 2006 | 1.15 | 0.57 | |
| 2007 | 1.16 | 0.57 | |
| 2008 | 1.18 | 0.63 | |
| 2009 | 1.22 | 0.62 | |
| 2010 | 1.31 | 0.63 | |
| 2011 | 1.31 | 0.73 | |
| 2012 | 1.29 | 0.71 | |
| 2013 | 1.31 | 0.75 | |
| 2014 | 1.30 | 0.88 | |
| 2015 | 1.30 | 0.92 | |
| 2016 | 1.33 | 0.94 | |
| 2017 | 1.35 | 1.01 | |
| 2018 | 1.34 | 1.01 | |
| 2019* | 1.38 | 1.07 | |
| 2020* | 1.38 | 1.21 | |
| 2021* | 2.6 | ||
| * Provisional figures. For 2021, only an estimate for the total environmental sector. | |||
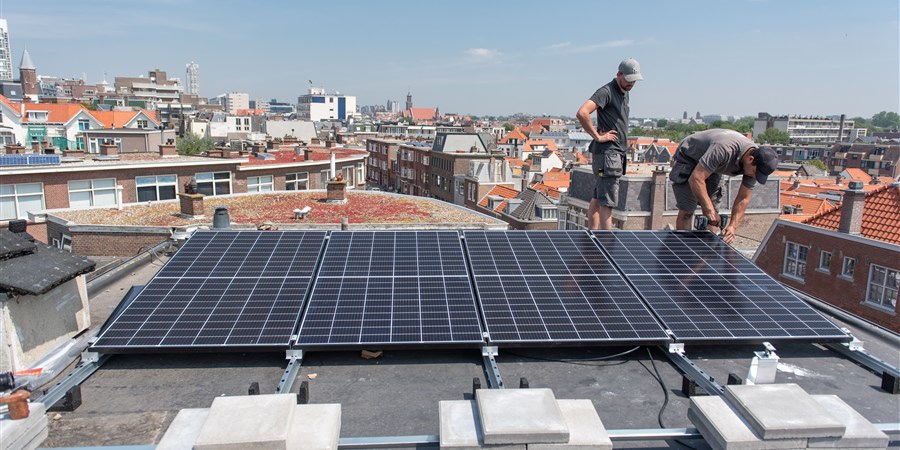
Employment in renewable energy continues to grow
Renewable energy production and energy conservation provided over 72 thousand FTEs in 2020, versus 40 thousand in 2011. However, there are differences between the activities. The largest increase can be seen in solar energy, particularly installation of solar panels. Employment related to this activity increased more than eleven-fold between 2011 and 2020. Employment related to wind energy doubled over the same period. Employment related to heat, geothermal energy and hydropower remained virtually the same.
| Jaar | Energy conservation (x 1,000 FTEs) | Heat, geothermal energy and hydropower (x 1,000 FTEs) | Solar energy (x 1,000 FTEs) | Wind energy (x 1,000 FTEs) | Other (including biomass and biofuels) (x 1,000 FTEs) |
|---|---|---|---|---|---|
| 2008 | 21.6 | 1.4 | 1.8 | 2.9 | 3.0 |
| 2009 | 21.4 | 1.5 | 2.0 | 3.0 | 3.4 |
| 2010 | 22.3 | 1.6 | 2.3 | 3.2 | 3.6 |
| 2011 | 27.4 | 1.7 | 2.8 | 4.0 | 3.9 |
| 2012 | 24.5 | 1.6 | 4.2 | 3.9 | 4.0 |
| 2013 | 24.8 | 1.6 | 5.6 | 4.1 | 4.0 |
| 2014 | 25.3 | 1.6 | 5.3 | 4.9 | 4.7 |
| 2015 | 26.5 | 1.5 | 6.7 | 5.5 | 3.7 |
| 2016 | 30.0 | 1.8 | 7.5 | 4.6 | 3.6 |
| 2017 | 31.4 | 1.9 | 9.0 | 4.8 | 3.6 |
| 2018 | 26.4 | 2.0 | 16.9 | 5.7 | 3.8 |
| 2019 | 24.6 | 2.4 | 24.2 | 6.6 | 3.9 |
| 2020* | 27.4 | 2.9 | 30.9 | 7.2 | 4.2 |
| * Provisional figures | |||||
Size of Dutch environmental sector equal to EU average
In 2019, the contribution of environmental activities to GDP amounted to 2.3 percent on average across the European Union. It was approximately the same within the Netherlands. The environmental sector is relatively largest in Finland, Estonia and Austria, with shares of 5.8 percent, 4.6 percent and 4.2 percent of GDP respectively. These countries have high levels of renewable energy production; management of forest areas is also a relatively large contributor to GDP. At the bottom of the ranking were Ireland (0.9 percent), Malta (1 percent) and Belgium (1.1 percent).
| Land | Share of environmental sector (% of GDP) |
|---|---|
| Finland | 5.8 |
| Estonia | 4.6 |
| Austria | 4.2 |
| Sweden | 3.5 |
| Denmark | 3.4 |
| Bugaria | 2.8 |
| Romania | 2.8 |
| Luxembourg | 2.8 |
| Lithuania | 2.7 |
| Latvia | 2.6 |
| Poland | 2.6 |
| European Union* | 2.3 |
| Netherlands | 2.3 |
| Portugal | 2.3 |
| Czechia | 2.3 |
| Spain | 2.3 |
| Germany | 2.0 |
| Italy | 1.9 |
| France | 1.8 |
| Slovenia | 1.6 |
| Croatia | 1.4 |
| Belgium | 1.1 |
| Malta | 1.1 |
| Ireland | 0.9 |
| * European Union excluding the United Kingdom | |
Sources
- StatLine - Environmental goods and services sector, activities; national accounts
- Eurostat - Environmental sector