GDP up on Bonaire in 2019, down on St Eustatius and Saba
The GDP volume change is the development of GDP value, adjusted for price changes. The adjustment for price changes is based on the consumer price index.
| Jaar | GDP volume (year-on-year % change) |
|---|---|
| 2013 | 2.4 |
| 2014 | 1.6 |
| 2015 | 3.4 |
| 2016 | 2.2 |
| 2017 | -1.3 |
| 2018 | 3.9 |
| 2019 | 6.3 |
Construction, accommodation and food services, and trade grew on Bonaire
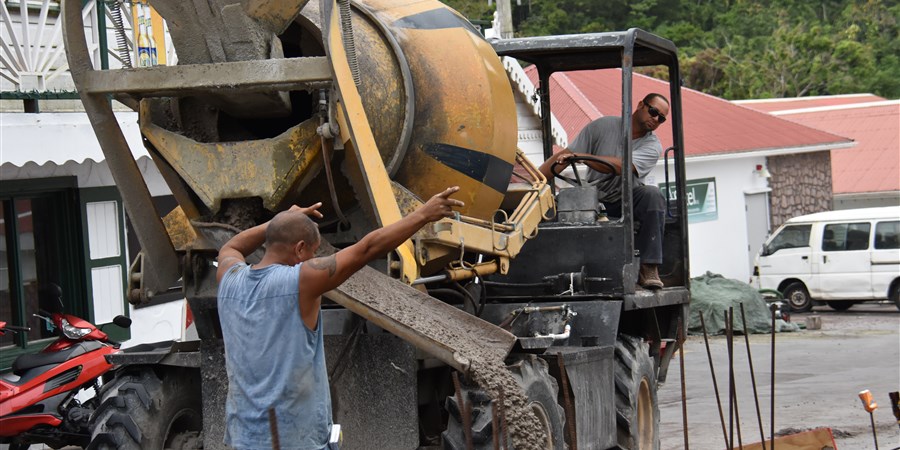
Just as in 2018, there was a lot of building activity on Bonaire. The value added of the construction sector on Bonaire rose by 23.3 percent. Trade benefited from the strong growth in construction, due to higher imports of building materials by DIY stores. Other companies in the trade sector, such as supermarkets, also fared well in 2019. The value added in this sector increased by 10.1 percent.
The 11.2-percent increase in the value added of the accommodation and food services sector in 2019 is mainly attributable to the larger number of tourists who came to Bonaire by boat or plane, along with growth of the island population. In 2019, inbound tourism by air rose by 6.8 percent and the number of cruise passengers by 15.3 percent. The population increased by 3.4 percent. This led to a higher demand for beverages and meals, benefiting both overnight accommodations and food and beverage outlets.
Due to the higher number of tourists, the value added of car rental companies in the business services sector increased as well. The total value added in business services rose by 6.5 percent.
The value added of energy and water companies rose by 10.8 percent as both electricity and tap water production increased.
There were also sectors that performed less well in 2019. The value added of the transportation, information and communication sector fell by 3.0 percent. The decline was spread widely across this sector. Manufacturing saw a 2.3-percent drop in value added. This was predominantly caused by a number of companies ceasing operations in 2019.
| Bedrijfstak | Volume of value added (year-on-year % change) |
|---|---|
| Construction | 23.3 |
| Accommodation and food services | 11.2 |
| Energy and water companies | 10.8 |
| Trade | 10.1 |
| Business services | 6.5 |
| Public sector | 5.7 |
| Culture, sports and recreation | 4.1 |
| Health care | 3.9 |
| Education | 3.2 |
| Financial services | 2.9 |
| Real estate activities | 1.7 |
| Agriculture | 0.1 |
| Manufacturing | -2.3 |
| Transportation, information and communication | -3.0 |
Contraction on St Eustatius and Saba
The 8.6 percent contraction on St Eustatius was mainly related to a few large companies on the island. Their production is mainly export-oriented and dependent on regional developments in the oil sector. Although these companies have a substantial impact on GDP, their impact on national income is limited. The profits of these companies are not included in the national income because they are wholly foreign-owned enterprises; they contribute to the island’s labour income in particular.
On Saba, the contraction was mainly caused by the construction and education sectors. Education showed a decrease in value added due to a declining number of students in 2019. The year-on-year decline in the construction sector can be explained by the fact that a lot of work was needed in 2018 to repair the damage from hurricanes Irma and Maria.
| Jaar | St Eustatius (year-on-year % change) | Saba (year-on-year % change) |
|---|---|---|
| 2013 | 0.8 | 5.5 |
| 2014 | -6.8 | -0.2 |
| 2015 | 3.2 | 1.2 |
| 2016 | -1.0 | -0.5 |
| 2017 | 6.6 | -1.4 |
| 2018 | -11.8 | -2.5 |
| 2019 | -8.6 | -5.3 |
Papiamentu
A Papiamentu translation of this news release can be obtained from Statistics Netherlands’ office on Bonaire by sending a request via email to: caribischnederland@cbs.nl
Sources
- StatLine - Caribbean Netherlands; gross domestic product (GDP)
- StatLine - Caribbean Netherlands, Bonaire; gross value added, branches
Related items
- CBS privacy regulations - Privacy