Dutch environmental sector continues to grow steadily
The environmental sector consists of private enterprises and public entities which produce goods and services aimed at protecting the environment and managing natural resources. These environmental activities help alleviate the environmental pressures (e.g. soil remediation, organic farming or soot filters) and preserve natural resources (e.g. recycling). The development and manufacture of products that are designed to be cleaner and more efficient than conventional products, such as electric vehicles and energy-efficient buildings, also belong to the environmental sector.
The share of the environmental sector in the Dutch economy has grown steadily, from 1.6 percent in 2001 to 2.4 percent in 2020. There is a clear difference in development between environmental protection activities and activities aimed at preserving natural resources. While the share of environmental protection activities in the economy showed relatively limited growth over the period 2001-2019 (0.1 percentage point), the share held by activities aimed at preserving natural resources doubled. This increase is closely linked to the energy transition.
| Jaar | Environmental protection (% of GDP) | Management of natural resources (% of GDP) |
|---|---|---|
| 2001 | 1.13 | 0.50 |
| 2002 | 1.15 | 0.52 |
| 2003 | 1.20 | 0.50 |
| 2004 | 1.16 | 0.50 |
| 2005 | 1.11 | 0.54 |
| 2006 | 1.15 | 0.56 |
| 2007 | 1.15 | 0.55 |
| 2008 | 1.19 | 0.61 |
| 2009 | 1.23 | 0.63 |
| 2010 | 1.25 | 0.69 |
| 2011 | 1.25 | 0.78 |
| 2012 | 1.24 | 0.77 |
| 2013 | 1.26 | 0.80 |
| 2014 | 1.25 | 0.89 |
| 2015 | 1.22 | 0.94 |
| 2016 | 1.23 | 0.98 |
| 2017 | 1.25 | 1.02 |
| 2018* | 1.23 | 1.02 |
| 2019* | 1.28 | 1.04 |
| * provisional figures | ||
Employment in the environmental sector up further
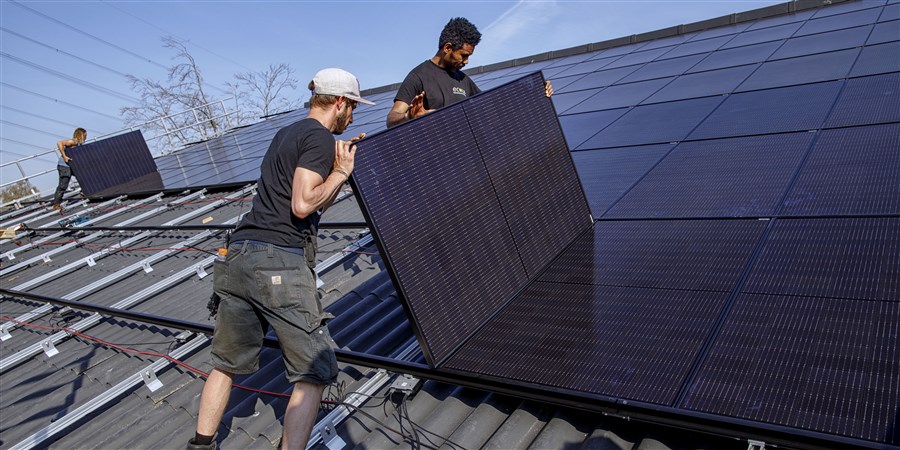
In 2019, the environmental sector was good for 148 thousand full-time jobs; this was still 116 thousand in 2001. The contribution made by the environmental sector to employment thus increased from 1.7 percent in 2001 to 1.9 percent in 2019. However, there are differences between the environmental activities. For example, employment related to waste management and recycling has remained almost constant while employment related to wastewater management has even decreased. On the other hand, employment related to renewable energy production and energy saving has increased significantly. Constructing wind turbines, installing solar panels and insulating homes is labour-intensive work. Electric transport, which falls under the category of 'protection of ambient air and climate', has also seen a sharp rise in employment in recent years.
| Jaar | Waste management and recycling (x 1,000 full-time jobs) | Wastewater management (x 1,000 full-time jobs) | Protection and remediation of soil, groundwater and surface water (x 1,000 full-time jobs) | Protection of ambient air and climate (x 1,000 full-time jobs) | Protection of biodiversity and landscapes (x 1,000 full-time jobs) | Renewable energy and energy saving (x 1,000 full-time jobs) | Quantitative water management at water boards (x 1,000 full-time jobs) | Other environmental protection activities, management of natural resources (x 1,000 full-time jobs) |
|---|---|---|---|---|---|---|---|---|
| 2019 | 36.1 | 15.3 | 12.2 | 6.5 | 5.3 | 47.3 | 6.2 | 18.8 |
| 2001 | 34.0 | 16.7 | 9.4 | 1.7 | 4.4 | 31.9 | 3.6 | 14.0 |
Size of Dutch environmental sector around the EU average
In 2017, the contribution of environmental activities to GDP across the European Union was 2.2 percent on average. In 2018, this share was slightly higher in the Netherlands at 2.3 percent. At the top of the ranking were Finland, Estonia and Austria, with respective shares of 5.7, 4.5 and 4.3 percent. At the bottom of the ranking were Ireland, Belgium (both 0.9 percent) and Malta (1 percent).
| Land | Share held by environmental sector (% of GDP) |
|---|---|
| Finland | 5.7 |
| Estonia | 4.5 |
| Austria | 4.3 |
| Denmark | 3.2 |
| Romania | 3.0 |
| Latvia | 2.5 |
| Luxembourg | 2.4 |
| Czech Rep. | 2.3 |
| Portugal | 2.3 |
| Netherlands | 2.3 |
| EU* | 2.2 |
| Spain | 2.2 |
| Poland | 2.2 |
| Lithuania | 2.2 |
| Sweden | 2.1 |
| Germany | 2.0 |
| Bulgaria | 1.9 |
| Italy | 1.9 |
| France | 1.6 |
| Slovenia | 1.6 |
| Croatia | 1.5 |
| Malta | 1.0 |
| Belgium | 0.9 |
| Ireland | 0.9 |
| * EU excluding the UK, 2017 | |
Sources
- StatLine - Environmental goods and services sector, activities; national accounts
- Eurostat - Environmental sector
Related items
- News release - Importance of environmental sector increasing