Appendix
Further elaboration of point 1: not all devices are active every hour
The attacker wants to determine the region x of the device i.
The area is known for all devices except i.
- Of all devices except i, the region is known.
- We know of device i that it is either in area A or in area B because we have the location of i in t-1 and t + 1. So we limit ourselves here to two possible areas. More possible areas only make the location more uncertain.
- We observe a fraction of the devices.
Given the counts per area, , nA en nB, and the known numbers per area, NA en NB, what is the probability that device i is in area A and what is the probability that the device is in area B. The latter automatically follows from the former because the device is either in A or in B.
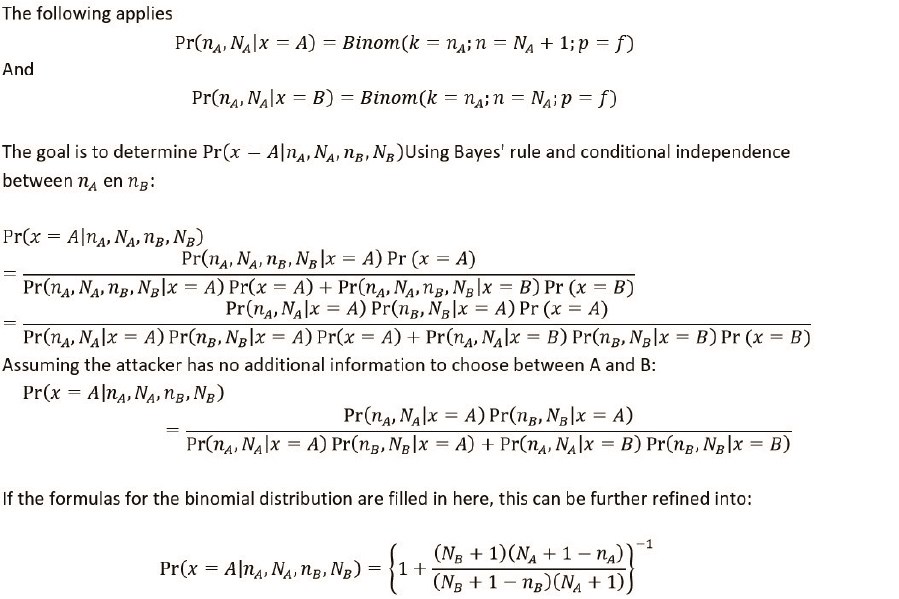
Figure 5 shows for different values of nA and nB the probability that i is in A zit. NA and NB are chosen a factor 1/0.8 higher than nA and nB, the fraction f is equal to 0.8. The vertical dotted line indicates the boundary under which the digits of a region are suppressed. The horizontal dotted line indicates a probability of 0.1: below this line we know with 90% certainty that i is in region B. For values of nA and nB, greater than 15, each region is more or less equally probable, so the data in the flow cube gives hardly any additional information about the location of the device. indicates the boundary below which the numbers of a area are suppressed.