Waste production
In the period 2000-2014, waste generation in the Dutch economy remained relatively constant at 62 billion kg, while the economy itself grew by almost 16 percent. This indicates a decoupling took place between waste production and economic growth. Between 2010 and 2016, the quantity of municipal waste generated fell by 5 percent.
| Production of waste (index (2000=100)) | GDP (index (2000=100)) | |
|---|---|---|
| 2000 | 100.00 | 100.00 |
| 2001 | 99.87 | 102.12 |
| 2002 | 99.74 | 102.23 |
| 2003 | 99.17 | 102.52 |
| 2004 | 98.59 | 104.60 |
| 2005 | 98.00 | 106.86 |
| 2006 | 97.42 | 110.62 |
| 2007 | 99.33 | 114.71 |
| 2008 | 101.23 | 116.66 |
| 2009 | 98.90 | 112.27 |
| 2010 | 96.57 | 113.84 |
| 2011 | 96.83 | 115.74 |
| 2012 | 97.09 | 114.51 |
| 2013 | 97.30 | 114.29 |
| 2014 | 97.50 | 115.92 |
Waste is defined as any material for which no further use is envisaged with regard to its production, treatment or consumption, and which can therefore be disposed of. This does not include any materials that are immediately reused then and there.
The issue
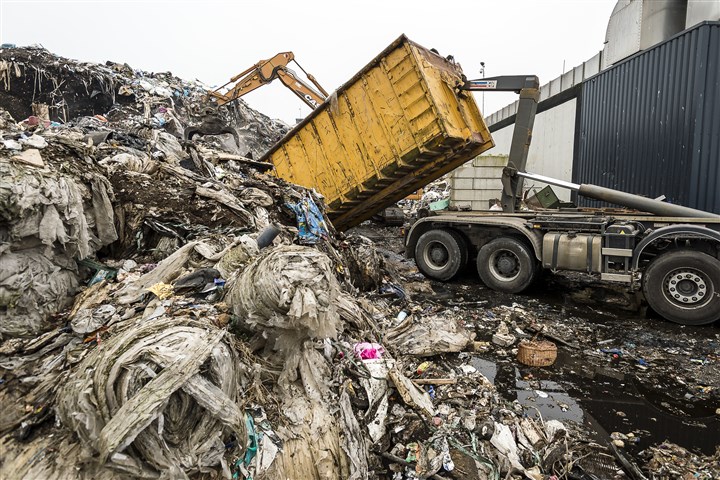
Waste treatment includes recycling and composting/fermentation, incineration and disposal in landfills. Each of these treatment methods causes its own particular type of environmental problems. Waste incineration produces environmentally harmful gas emissions, while landfills take up space and require many years of maintenance. Recycling causes less environmental impact, but the processing involved still uses energy and can result in lower quality materials. Thus, one approach is to reduce waste production, which has the effect of boosting the productivity of the production process.
Analysis
In the period 2000-2014, the quantity of waste produced by the Dutch economy fluctuated between 60.5 billion kg and 63.5 billion kg. During this period, the economy grew by almost 16 percent and consumption also increased. The percentage of waste used for recycling purposes has remained virtually stable in recent years. In the period 2000-2014, this ranged between 80 and 83 percent. From 2010 to 2016, the amount of municipal waste collected fell by 5 percent. Most waste is generated by the construction industry, followed by the manufacturing industry and households.
International comparison
Among European nations, the Netherlands’ waste intensity (kilograms of waste generated per unit of GDP) is about average. The extremes of the European ranking reflect differences in company structure. Much of the waste generated in Estonia is related to the extraction of oil from oil shale.
Companies and households show different patterns of development over time. Households produced comparable amounts of waste in 2004 and 2014, while the processing industry cut its waste production by 26 percent over that period. The same pattern can be seen in the Netherlands. Waste intensity in 2014 amounted to 66 tonnes per million euros of GDP. The corresponding figure for 2004 was 78 tonnes. Other European countries have also significantly improved their waste intensity. As a result, the Netherlands – which finished in 8th place in 2006 – had dropped to 12th place by 2014.
| Intensity of waste production - 2014 (x 1,000 kg/ million euros) | |
|---|---|
| Luxembourg | 18.3 |
| Norway | 25.7 |
| Iceland | 31.7 |
| Denmark | 38.5 |
| Ireland | 40.2 |
| Sweden | 42.6 |
| United Kingdom | 44.1 |
| France | 44.6 |
| Austria | 47.5 |
| Germany | 52.8 |
| Spain | 64.0 |
| Netherlands | 65.6 |
| Italy | 66.5 |
| Finland | 66.7 |
| Portugal | 71.1 |
| Czech Republic | 75.1 |
| Slovakia | 83.2 |
| Belgium | 87.4 |
| Slovenia | 88.6 |
| Hungary | 114.1 |
| Greece | 118.0 |
| Poland | 183.1 |
| Estonia | 633.0 |
| Source: Eurostat | |