Manufacturing output 11.1 percent higher in September, year on year
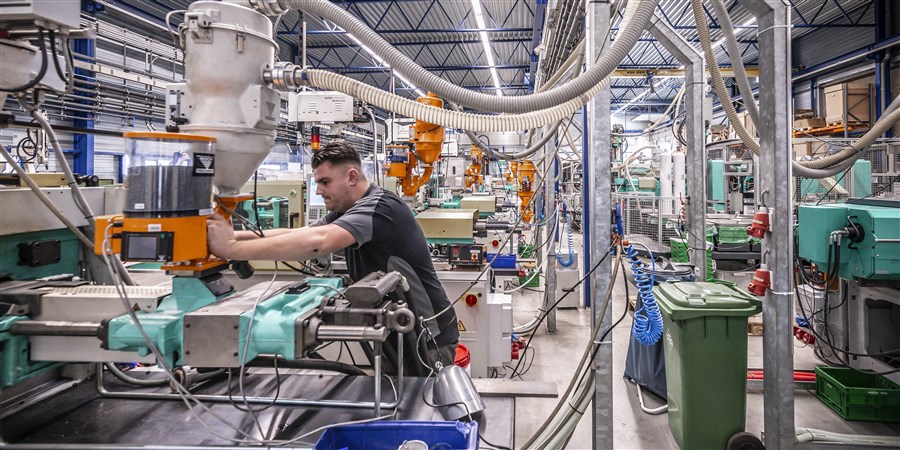
In September 2026, the calendar-adjusted output of the Dutch manufacturing sector was 11.1 percent higher than it was in September 2025, according to Statistics Netherlands (CBS). In August, the year-on-year increase was 11.7 percent. Output was up in five of the eight largest industrial sectors in September.
| Jaar | Maand | Manufacturing output (year-on-year % change) |
|---|---|---|
| 2022 | October | 5.4 |
| 2022 | November | 3.5 |
| 2022 | December | 4.0 |
| 2023 | January | 2.6 |
| 2023 | February | 3.1 |
| 2023 | March | 4.3 |
| 2023 | April | -1.2 |
| 2023 | May | -0.9 |
| 2023 | June | 1.3 |
| 2023 | July | -0.4 |
| 2023 | August | -1.5 |
| 2023 | Septemb | -3.8 |
| 2023 | October | -4.0 |
| 2023 | November | -3.7 |
| 2023 | December | -0.5 |
| 2024 | January | -5.1 |
| 2024 | February | -2.9 |
| 2024 | March | -6.4 |
| 2024 | April | -4.2 |
| 2024 | May | -4.2 |
| 2024 | June | -5.2 |
| 2024 | July | -4.5 |
| 2024 | August | -0.9 |
| 2024 | September | -3.1 |
| 2024 | October | -1.9 |
| 2024 | November | -0.6 |
| 2024 | December | -4.7 |
| 2025 | January | 0.3 |
| 2025 | February | -0.5 |
| 2025 | March | 1.0 |
| 2025 | April | -0.5 |
| 2025 | May | 0.1 |
| 2025 | June | 0.0 |
| 2025 | July | -1.3 |
| 2025 | August | -0.3 |
| 2025 | September | 1.2 |
| 2025 | October | 0.7 |
| 2025 | November | -0.2 |
| 2025 | December | -0.6 |
| 2026 | January | 1.0 |
| 2026 | February | -1.0 |
| 2026 | March | 1.9 |
| 2026 | April | 5.7 |
| 2026 | May | 7.0 |
| 2026 | June | 5.0 |
| 2026 | July | 9.4 |
| 2026 | August | 11.7 |
| 2026 | September | 11.1 |
Growth in five of the eight manufacturing sectors
Production in September was up in five of the eight largest industrial sectors, year on year. The machinery sector recorded the largest increase in output once again, while the repair and installation of machinery and equipment sector recorded the largest decline.
| Branche | Manufacturing output (year-on-year % change) |
|---|---|
| Machinery | 43.1 |
| Metal products | 2.4 |
| Food products | 0.6 |
| Transport equipment | 0.5 |
| Chemical products | 0.3 |
| Rubber and plastic products | -1.9 |
| Electrical and electronic equipment | -2.5 |
| Reparatie en installatie machines | -4.3 |
| Repair and installation of machinery | |
| Manufacturing (total) | 11.1 |
| 1)The sectors listed in the graph account for almost 80 percent of total manufacturing output. | |
Producer confidence deteriorates in October
Producers were less positive in October than in September, as producer confidence fell from 4.2 in September to 2.3 in October. Manufacturers were less positive about their output over the next three months and about their order positions and restocking.
Producer confidence in October was above the 20-year average of -1.4. Confidence reached an all-time high (10.5) in October 2021 and an all-time low (-31.5) in April 2020.
Confidence among manufacturers deteriorated in seven of the nine underlying manufacturing sectors. It only improved in the transport equipment sector and other manufacturing. Manufacturers in electrical engineering– which includes the machinery industry – were once again the most positive (8.0).
| Jaar | Maand | Producer confidence (average composite score) |
|---|---|---|
| 2022 | November | 1.1 |
| 2022 | December | 1.0 |
| 2023 | January | 1.2 |
| 2023 | February | 1.0 |
| 2023 | March | 1.1 |
| 2023 | April | -0.3 |
| 2023 | May | -1.8 |
| 2023 | June | -2.8 |
| 2023 | July | -2.8 |
| 2023 | August | -4.7 |
| 2023 | September | -4.1 |
| 2023 | October | -3.6 |
| 2023 | November | -2.6 |
| 2023 | December | -5.7 |
| 2024 | January | -4.2 |
| 2024 | February | -4.1 |
| 2024 | March | -4.7 |
| 2024 | April | -3.6 |
| 2024 | May | -2.9 |
| 2024 | June | -2.5 |
| 2024 | July | -2.8 |
| 2024 | August | -1.9 |
| 2024 | September | -2.0 |
| 2024 | October | -3.1 |
| 2024 | November | -1.9 |
| 2024 | December | -1.5 |
| 2025 | January | -1.9 |
| 2025 | February | -1.6 |
| 2025 | March | -1.7 |
| 2025 | April | -3.0 |
| 2025 | May | -3.7 |
| 2025 | June | -4.5 |
| 2025 | July | -4.6 |
| 2025 | August | -2.9 |
| 2025 | September | -1.7 |
| 2025 | October | -1.1 |
| 2025 | November | -1.9 |
| 2025 | December | -1.4 |
| 2026 | January | 0.8 |
| 2026 | February | -1.1 |
| 2026 | March | -0.7 |
| 2026 | April | -0.7 |
| 2026 | May | -2.0 |
| 2026 | June | 1.3 |
| 2026 | July | 2.4 |
| 2026 | August | 3.7 |
| 2026 | September | 4.2 |
| 2026 | October | 2.3 |
Sources
- StatLine - Industry; production and sales, changes and index, 2021=100
- StatLine - Producer confidence; sentiment indicator manufacturing industry
- StatLine – Business Survey Netherlands (COEN)
Related items
- Dossier - Business cycle
- Survey description - Turnover and production