1.7 percent of employed people are older than the state pension age
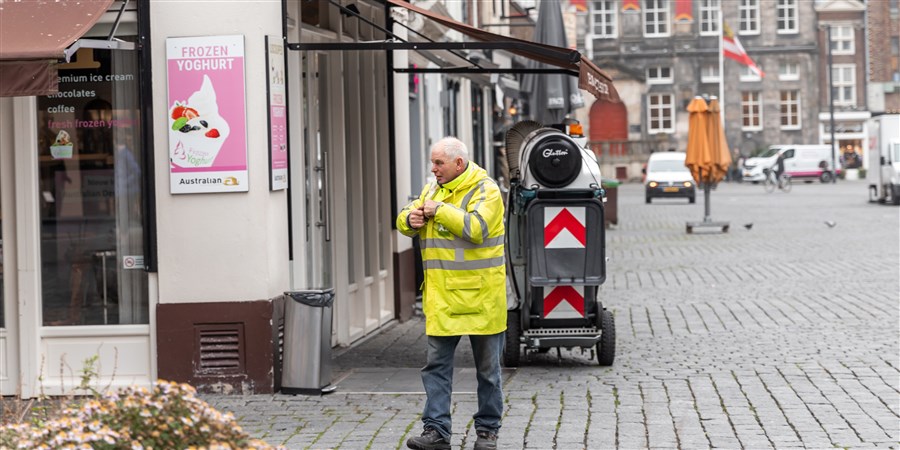
Of all those working under an employment contract in Q2 2026, 1.7 percent were older than the state pension age: a total of 152 thousand people. In Q1 2018, this share was 1.2 percent: 96 thousand employed persons. Men are more likely than women to remain in paid employment after reaching the state pension age. Statistics Netherlands (CBS) reports this on the basis of new figures published in the ‘Labour Market Mobility Monitor’.
The highest shares are seen in the real estate activities sector and the transportation and storage sector, at 4.3 percent and 3.6 percent respectively. The share was lowest in the public administration and government services sectors (0.6 percent) and in information and communication (0.7 percent).
| Bedrijfstakken | Proportion of employees above the state pension age (% of employed persons) |
|---|---|
| Real estate activities | 4.3 |
| Transportation and storage | 3.6 |
| Specialised business services | 2.9 |
| Agriculture, forestry and fishing | 2.9 |
| Other services | 2.5 |
| Culture, sports and recreation | 2.4 |
| Financial services | 2.2 |
| Renting, leasing and other business services | 2.2 |
| Trade | 1.9 |
| Total | 1.7 |
| Construction | 1.5 |
| Manufacturing | 1.3 |
| Energy supply | 1.3 |
| Education | 1.3 |
| Water companies and waste management | 1.2 |
| Health and social care | 1.2 |
| Accommodation and food services | 1.1 |
| Mining & quarrying | 1.0 |
| Information and communication | 0.7 |
| Public administration and government services | 0.6 |
More men continue working than women
Of all males employed in Q2 2026, 2.3 percent were older than the state pension age. Among women, this share was 1.1 percent. While the state pension age has risen gradually to 67 years since 2013, the number of people above that age who are still in employment is also increasing. Between Q1 2018 to Q2 2026, the shares among men and women rose by approximately 0.5 percentage points.
| Jaar | Kwartaal | Men (% of employed persons) | Women (% of employed persons) | Total (% of employed persons) |
|---|---|---|---|---|
| 2018 | Q1 | 1.77 | 0.61 | 1.23 |
| 2018 | Q2 | 1.81 | 0.63 | 1.26 |
| 2018 | Q3 | 1.86 | 0.64 | 1.29 |
| 2018 | Q4 | 1.91 | 0.67 | 1.32 |
| 2019 | Q1 | 1.80 | 0.62 | 1.24 |
| 2019 | Q2 | 1.83 | 0.64 | 1.27 |
| 2019 | Q3 | 1.87 | 0.65 | 1.29 |
| 2019 | Q4 | 1.91 | 0.68 | 1.33 |
| 2020 | Q1 | 1.82 | 0.66 | 1.27 |
| 2020 | Q2 | 1.74 | 0.65 | 1.22 |
| 2020 | Q3 | 1.82 | 0.67 | 1.27 |
| 2020 | Q4 | 1.84 | 0.69 | 1.29 |
| 2021 | Q1 | 1.82 | 0.69 | 1.28 |
| 2021 | Q2 | 1.89 | 0.74 | 1.34 |
| 2021 | Q3 | 1.94 | 0.74 | 1.37 |
| 2021 | Q | 2.01 | 0.79 | 1.43 |
| 2022 | Q1 | 1.93 | 0.76 | 1.37 |
| 2022 | Q2 | 1.97 | 0.78 | 1.40 |
| 2022 | Q3 | 2.01 | 0.80 | 1.43 |
| 2022 | Q4 | 2.09 | 0.86 | 1.50 |
| 2023 | Q1 | 2.00 | 0.80 | 1.42 |
| 2023 | Q2 | 2.03 | 0.83 | 1.45 |
| 2023 | Q3 | 2.07 | 0.84 | 1.48 |
| 2023 | Q4 | 2.12 | 0.89 | 1.53 |
| 2024 | Q1 | 2.07 | 0.86 | 1.49 |
| 2024 | Q2 | 2.10 | 0.90 | 1.52 |
| 2024 | Q3 | 2.13 | 0.91 | 1.55 |
| 2024 | Q4 | 2.19 | 0.96 | 1.60 |
| 2025 | Q1 | 2.17 | 0.95 | 1.59 |
| 2025 | Q2 | 2.20 | 0.98 | 1.62 |
| 2025 | Q3 | 2.23 | 0.99 | 1.64 |
| 2025 | Q4 | 2.29 | 1.04 | 1.69 |
| 2026 | Q1 | 2.28 | 1.05 | 1.69 |
| 2026 | Q2 | 2.32 | 1.08 | 1.72 |
Almost 21 thousand people above the state pension age went to work in a different sector
In Q2 2026, over 20 thousand people above the state pension age started new jobs. This represented 1.3 percent of the total number of people in employment who had not been working the previous year. Around half of these people had been working in a different sector and the rest had not been in employment at all.
The proportion of people aged above the state pension age leaving the labour force – those who were in employment in the previous year but are no longer in employment – is also small (2.2 percent). The number of people of working age (between 55 years old and the state pension age) leaving the labour force is larger, at 14.4 percent. The largest group of employed people leaving the labour force are younger than 25. These people are also more likely than average to enter the labour force, either after completing an educational programme or transferring from a different sector.
Among the oldest groups (aged 55 and over), people leaving the labour force are mainly people who are retiring (sometimes early), and this is also true of most people above the state pension age. A small proportion of them (9 percent) continue to work in a different sector after reaching the state pension age. Among people aged between 55 and the state pension age, 37 percent leave the labour force to retire, 22 percent leave to claim benefits, and 20 percent continue to work in a different sector.
| Leeftijd | Aged under 25 (%) | 25-34 yrs (%) | 35-44 yrs (%) | 45-54 yrs (%) | 55- state pension age (%) | Above the state pension age (%) |
|---|---|---|---|---|---|---|
| Entering | 699.2 | 396.4 | 216.7 | 148.9 | 102.1 | 20.2 |
| Leaving | 569.1 | 345.8 | 201.8 | 148.6 | 218.4 | 34.3 |
Sources
- Dashboard - Labour Market Mobility Monitor (in Dutch)