1.7 million cars sold in 2025, 259 thousand were plug-in cars
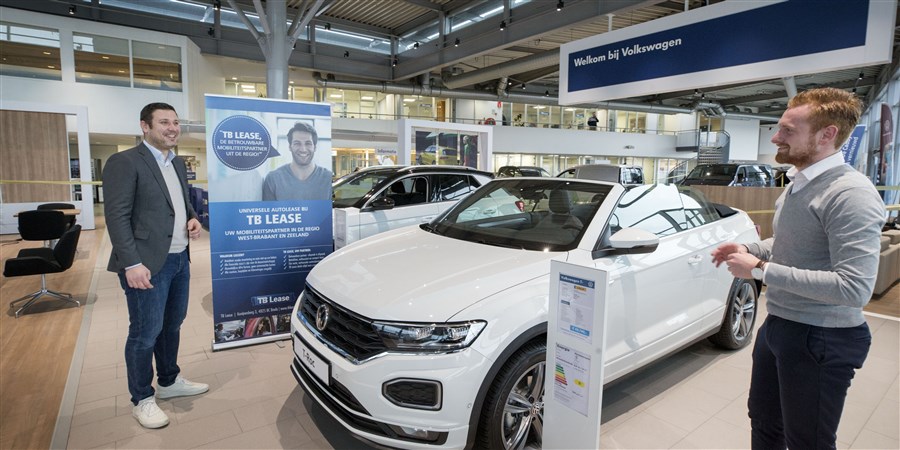
Over 1.7 million cars were sold or changed hands in 2025. The 10 percent of people in the second-highest income decile were the most likely to buy cars. They bought nearly 236 thousand cars in 2025. The 10 percent of people on the lowest incomes were the least likely to buy cars – around 83 thousand in 2025. This is according to figures from Statistics Netherlands (CBS).
The cars referred to in this news release include new and second-hand purchases and changes of ownership in 2025. Cars that changed hands more than once in 2025 were counted only once.
The top 30 percent of earners bought over 40 percent of the cars sold, while the 30 percent of people on the lowest incomes bought nearly 17 percent. These figures are based on standardised disposable household income.
| inkomensgroep | cars (x 1,000) |
|---|---|
| 1st income decile (lowest incomes) | 83.3 |
| 2nd income deile | 98.1 |
| 3rd income decile | 106.5 |
| 4th income decile | 137.2 |
| 5th income decile | 159.3 |
| 6th income decile | 183.2 |
| 7th income decile | 199.8 |
| 8th income decile | 220.8 |
| 9th income decile | 235.7 |
| 10th income decile (highest incomes) | 233.9 |
Petrol-driven cars remain the most popular
Of all the cars that changed hands, nearly 1.4 million were petrol-driven. The proportion of diesel cars bought was highest in the lowest income decile. Nearly 259 thousand of the cars sold were FEVs (fully electric vehicles) or PHEVs (plug-in hybrids), nearly 75 thousand of which were purchased by people in the highest income bracket. A total of 48 thousand plug-in cars were bought by the second-highest income decile.
| inkomensgroep | Petrol (%) | Diesel (%) | PHEV (%) | FEV (%) | LPG + other (%) |
|---|---|---|---|---|---|
| 1st income decile (lowest incomes) | 71800 | 4000 | 3900 | 2300 | 1300 |
| 2nd income decile | 88500 | 3100 | 3300 | 1900 | 1300 |
| 3rd income decile | 95800 | 3000 | 4100 | 2600 | 1000 |
| 4th income decile | 121500 | 3800 | 6500 | 4100 | 1300 |
| 5th income decile | 138000 | 4300 | 9700 | 5800 | 1500 |
| 6th income decile | 154800 | 4900 | 13700 | 8300 | 1600 |
| 7th income decile | 164100 | 5200 | 17800 | 11000 | 1600 |
| 8t income decile | 176300 | 5700 | 22700 | 14400 | 1800 |
| 9th income decile | 179600 | 6100 | 28400 | 19800 | 1800 |
| 10th income decile (highest incomes) | 151400 | 6300 | 43300 | 31500 | 1300 |
The oldest cars were bought by the lowest income groups
Most of the cars sold – over 395 thousand – were 16 years old or older. Cars that were one or two years old were purchased the least frequently, totalling around 137 thousand. A total of 148 thousand cars were purchased brand new. Two-thirds of the cars purchased by the 20 percent of people on the lowest incomes were more than ten years old.
People in the top 20 percent income bracket were the most likely to buy a new or almost new car: a quarter of the cars they bought were no more than two years old.
| inkomensgroep | New (%) | 1 or 2 years old (%) | 3-5 years old (%) | 6-10 years old (%) | 11-15 years old (%) | 16 years or older (%) |
|---|---|---|---|---|---|---|
| 1st income decile (lowest incomes) | 2300 | 2600 | 7400 | 13900 | 22300 | 34700 |
| 2nd income decile | 2800 | 3400 | 8500 | 17400 | 26600 | 39400 |
| 3rd income decile | 5400 | 5400 | 12400 | 22400 | 26600 | 34300 |
| 4th income decile | 8700 | 8300 | 18900 | 31500 | 31400 | 38400 |
| 5th income decile | 11500 | 10900 | 25200 | 38300 | 35000 | 38500 |
| 6th income decile | 15100 | 13500 | 32400 | 44600 | 37200 | 40300 |
| 7th income decile | 17900 | 16500 | 39000 | 49300 | 38200 | 38900 |
| 8th income decile | 21500 | 19800 | 46400 | 53800 | 39700 | 39600 |
| 9th income decile | 26000 | 23700 | 53300 | 56000 | 38700 | 38000 |
| 10th income decile (highest incomes) | 35800 | 31500 | 57900 | 49300 | 28600 | 30700 |
The highest number of cars sold was in Zuid-Holland
Zuid-Holland saw the highest number of cars sold and changing hands: 325 thousand. Noord-Brabant and Noord-Holland followed with 268 thousand and 236 thousand cars, respectively. The fewest cars were sold in Flevoland and Zeeland: 49 thousand and just over 41 thousand, respectively.
| Provincie | cars (x 1,000) |
|---|---|
| Zuid-Holland | 325.3 |
| Noord-Brabant | 268.1 |
| Noord-Holland | 235.8 |
| Gelderland | 220.6 |
| Overijssel | 127.4 |
| Utrecht | 120.2 |
| Limburg | 117.0 |
| Fryslân | 76.2 |
| Groningen | 64.1 |
| Drenthe | 61.4 |
| Flevoland | 49.0 |
| Zeeland | 41.1 |