Butterfly numbers continue to fall, including common species
| Year | Numbers counted ((1992=100)) | Trend (1992=100) ((1992=100)) | Confidence interval ((1992=100)) |
|---|---|---|---|
| 1992 | 105.17 | 100 | 90.17 - 110.74 |
| 1993 | 95.85 | 95.05 | 87.38 - 103.19 |
| 1994 | 70.94 | 90.58 | 84.65 - 96.94 |
| 1995 | 97.51 | 86.52 | 81.85 - 91.54 |
| 1996 | 89.19 | 82.89 | 79.01 - 87.1 |
| 1997 | 81.7 | 79.62 | 76.11 - 83.44 |
| 1998 | 83.65 | 76.68 | 73.35 - 80.31 |
| 1999 | 63.53 | 74.08 | 70.82 - 77.62 |
| 2000 | 81.83 | 71.83 | 68.62 - 75.31 |
| 2001 | 58.02 | 69.74 | 66.67 - 73.09 |
| 2002 | 71 | 67.77 | 64.84 - 70.97 |
| 2003 | 84.86 | 66.08 | 63.2 - 69.18 |
| 2004 | 60.52 | 64.85 | 61.95 - 67.9 |
| 2005 | 66.46 | 64.26 | 61.45 - 67.24 |
| 2006 | 62.89 | 64.2 | 61.47 - 67.05 |
| 2007 | 51.94 | 64.35 | 61.57 - 67.19 |
| 2008 | 49.07 | 64.39 | 61.54 - 67.27 |
| 2009 | 79.41 | 64.72 | 61.99 - 67.49 |
| 2010 | 83.45 | 65.61 | 63.05 - 68.3 |
| 2011 | 75.69 | 66.5 | 63.89 - 69.23 |
| 2012 | 48.06 | 66.79 | 64.15 - 69.59 |
| 2013 | 71.41 | 66.68 | 64.13 - 69.39 |
| 2014 | 78.3 | 66.55 | 64.06 - 69.14 |
| 2015 | 60.85 | 66.07 | 63.65 - 68.56 |
| 2016 | 57.26 | 64.94 | 62.62 - 67.34 |
| 2017 | 72.44 | 63.24 | 61.07 - 65.46 |
| 2018 | 66.89 | 61.23 | 59.25 - 63.25 |
| 2019 | 55.87 | 58.9 | 57.11 - 60.74 |
| 2020 | 52.95 | 56.28 | 54.58 - 58.02 |
| 2021 | 50.88 | 53.4 | 51.69 - 55.16 |
| 2022 | 59.71 | 50.33 | 48.46 - 52.28 |
| 2023 | 46.85 | 47.13 | 44.96 - 49.36 |
| 2024 | 40.83 | 43.85 | 41.35 - 46.48 |
| Bron: CBS, Dutch Butterfly Conservation | |||
| ¹⁾ Average of 54 species of butterflies | |||
Butterfly numbers at their lowest since monitoring started
In 2024, the number of butterflies counted was the lowest since the start of the butterfly monitoring scheme. Nine of the 54 butterfly species studied, including the Essex skipper and the silver-studded blue, were the lowest in number since 1992, while the small heath was the highest in number. Over the entire period, 30 butterfly species have declined in number and 12 species have seen an increase.
The dusky large blue - a European protected species - has not been seen at all and seems to have disappeared from the Netherlands.
Sharp decline in common species such as the common blue
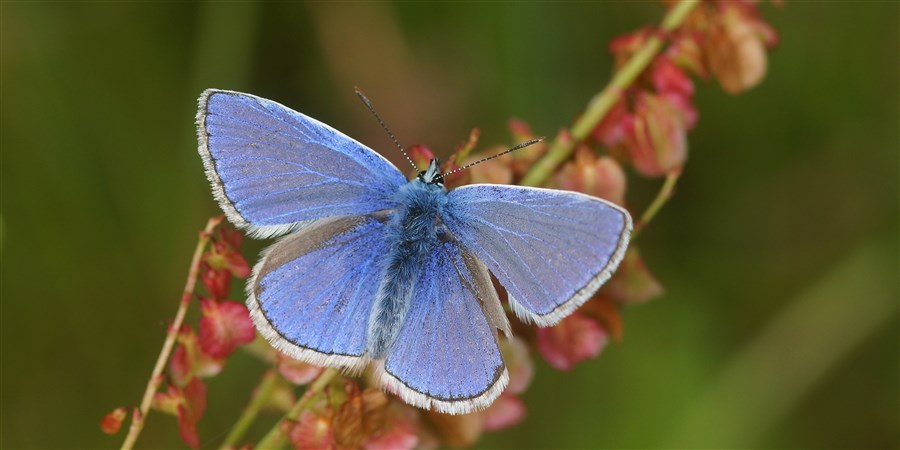
The 15 most common butterflies in the Netherlands, including the common blue and cabbage white, have declined by over 35 percent in the past decade. Due to their high numbers, these common species play an important role in nature, as pollinators of flowers and food sources for other animal species, for instance.Over the entire period, nine of these common species have declined in number and three species have increased.
| Year | Numbers counted ((1992=100)) | Trend (1992=100) ((1992=100)) | Confidence interval ((1992=100)) |
|---|---|---|---|
| 1992 | 128.66 | 100 | 82.98 - 120.18 |
| 1993 | 90.57 | 103.72 | 89.37 - 120.29 |
| 1994 | 82.16 | 107.21 | 95 - 120.92 |
| 1995 | 121.35 | 110.46 | 99.89 - 122.16 |
| 1996 | 121.57 | 113.38 | 103.34 - 124.14 |
| 1997 | 98.85 | 116.01 | 105.96 - 126.71 |
| 1998 | 140.47 | 118.29 | 107.99 - 129.4 |
| 1999 | 96.04 | 120.16 | 109.42 - 131.96 |
| 2000 | 146.73 | 121.52 | 110.18 - 133.95 |
| 2001 | 99.68 | 122.28 | 110.81 - 134.82 |
| 2002 | 130.03 | 122.44 | 110.98 - 135.11 |
| 2003 | 178.46 | 122.07 | 110.29 - 135.21 |
| 2004 | 98.62 | 121.22 | 109.13 - 134.56 |
| 2005 | 124.84 | 119.33 | 107.86 - 131.68 |
| 2006 | 124.92 | 116.43 | 105.66 - 128.23 |
| 2007 | 115.82 | 113.4 | 102.7 - 124.94 |
| 2008 | 73.57 | 111.03 | 100.26 - 122.58 |
| 2009 | 122.57 | 109.42 | 99.23 - 120.24 |
| 2010 | 124.75 | 108.02 | 98.52 - 118.03 |
| 2011 | 110.04 | 106.62 | 97.45 - 116.53 |
| 2012 | 85.58 | 105.05 | 95.96 - 114.85 |
| 2013 | 101.56 | 103.69 | 95.12 - 113.01 |
| 2014 | 128.24 | 102.6 | 94.51 - 111.37 |
| 2015 | 98.7 | 101.15 | 93.32 - 109.63 |
| 2016 | 84.53 | 98.73 | 91.29 - 106.78 |
| 2017 | 121.49 | 95.53 | 88.68 - 103.02 |
| 2018 | 91.4 | 92.08 | 85.92 - 98.9 |
| 2019 | 92.53 | 88.32 | 82.77 - 94.49 |
| 2020 | 83.95 | 84.23 | 79.02 - 89.9 |
| 2021 | 71.63 | 79.85 | 74.77 - 85.24 |
| 2022 | 86.37 | 75.28 | 69.91 - 80.92 |
| 2023 | 59.41 | 70.6 | 64.5 - 77.12 |
| 2024 | 70.63 | 65.87 | 58.82 - 73.6 |
| Bron: CBS, Dutch Butterfly Conservation | |||
| ¹⁾ Average of 15 common species of butterflies | |||
Grassland butterflies down by a third, 98 percent fewer wall brown
Numbers of ten specific species of grassland butterflies have fallen by an average of 69 percent since 1992. This also brings the numbers of these species to their lowest level since the start of the census. These ten butterfly species are an important indicator of grassland quality. The change in grassland butterfly numbers is also used to evaluate the natural value of this type of habitat.
The numbers of wall brown have fallen by over 98 percent since 1992. The meadow brown, the most frequently counted butterfly, has also been declining in number for years. On the other hand, some grassland species are increasing in number, such as the small heath and the orange-tip.
| Year | Numbers counted ((1992=100)) | Trend (1992=100) ((1992=100)) | Confidence interval ((1992=100)) |
|---|---|---|---|
| 1992 | 76.22 | 100 | 74.99 - 132.86 |
| 1993 | 110.02 | 94.33 | 74.86 - 118.54 |
| 1994 | 84.47 | 89.1 | 73.77 - 107.22 |
| 1995 | 99.72 | 84.19 | 72.16 - 98.21 |
| 1996 | 97.89 | 79.71 | 69.88 - 91.29 |
| 1997 | 73.84 | 75.55 | 66.71 - 85.8 |
| 1998 | 81.85 | 71.66 | 63.43 - 80.94 |
| 1999 | 52.13 | 68.14 | 60.3 - 76.92 |
| 2000 | 80.35 | 65.08 | 57.37 - 73.62 |
| 2001 | 47.76 | 62.13 | 54.83 - 70.08 |
| 2002 | 64.21 | 59.2 | 52.52 - 66.47 |
| 2003 | 66.89 | 56.68 | 50.36 - 63.59 |
| 2004 | 53.76 | 54.88 | 48.71 - 61.62 |
| 2005 | 52.35 | 54.08 | 48.31 - 60.32 |
| 2006 | 51.81 | 54.02 | 48.63 - 59.87 |
| 2007 | 50.99 | 54.18 | 48.75 - 60.11 |
| 2008 | 39.24 | 54.08 | 48.6 - 60.04 |
| 2009 | 64.72 | 54.09 | 48.76 - 59.84 |
| 2010 | 68.23 | 54.6 | 49.38 - 60.15 |
| 2011 | 70.41 | 55.08 | 49.82 - 60.82 |
| 2012 | 37.21 | 55 | 49.75 - 60.85 |
| 2013 | 57.5 | 54.53 | 49.44 - 60.05 |
| 2014 | 60.69 | 53.99 | 49.21 - 59.2 |
| 2015 | 50.63 | 53.14 | 48.63 - 58.06 |
| 2016 | 44.05 | 51.72 | 47.47 - 56.43 |
| 2017 | 60.77 | 49.82 | 45.95 - 54.11 |
| 2018 | 48.76 | 47.68 | 44.21 - 51.47 |
| 2019 | 47.12 | 45.3 | 42.25 - 48.64 |
| 2020 | 38.59 | 42.72 | 40.04 - 45.6 |
| 2021 | 41.95 | 39.99 | 37.55 - 42.61 |
| 2022 | 39.24 | 37.15 | 34.7 - 39.82 |
| 2023 | 32.92 | 34.27 | 31.55 - 37.22 |
| 2024 | 30.77 | 31.38 | 28.28 - 34.91 |
| Bron: CBS, Dutch Butterfly Conservation | |||
| ¹ Average of 10 specific species of grassland butterflies | |||
Multiple causes of falling butterfly numbers
Many factors are contributing to the decline in butterfly populations. The main cause is the loss and fragmentation of suitable habitats, such as heathland, open dunes and herb-rich grasslands [1]. In addition, these habitats are gradually becoming less suitable for butterflies, due in part to atmospheric nitrogen deposition. This has led to the disappearance of open spaces and nectar plants, which butterflies need in these areas [2]. Climate change, with more extreme weather conditions, and drought have exacerbated the situation in recent decades. Finally, scientific research points to the use of chemical pesticides (plant protection products) as a major cause for the decline [3].Some butterfly species have been increasing in number recently, particularly species that benefit from greater forest diversity and higher temperatures.
Sources
- CLO website - Environmental Data Compendium
Related items
- [1] Strien, A.J. van et al - Over a century of data reveal more than 80% decline in butterflies in the Netherlands.
- [2] Warren, M. S. et al - The decline of butterflies in Europe: Problems, significance, and possible solutions.
- [3] Deynze, B. van et al. - Insecticides, more than herbicides, land use, and climate, are associated with declines in butterfly species richness and abundance in the American Midwest.