Manufacturers marginally less negative in February
In February, producer confidence was below the 20-year average of -1.3. It reached an all-time high (10.4) in October 2021 and an all-time low (-31.5) in April 2020.
| year | month | balance (average of the component questions) |
|---|---|---|
| 2020 | March | -2.6 |
| 2020 | April | -31.5 |
| 2020 | May | -28.1 |
| 2020 | June | -18.7 |
| 2020 | July | -11.8 |
| 2020 | August | -7.8 |
| 2020 | September | -7 |
| 2020 | October | -7.7 |
| 2020 | November | -6.4 |
| 2020 | December | -3.2 |
| 2021 | January | -1.8 |
| 2021 | February | -2.6 |
| 2021 | March | 0.6 |
| 2021 | April | 3.6 |
| 2021 | May | 5.6 |
| 2021 | June | 7.8 |
| 2021 | July | 9.2 |
| 2021 | August | 7.1 |
| 2021 | September | 9.1 |
| 2021 | October | 10.4 |
| 2021 | November | 10.1 |
| 2021 | December | 7.3 |
| 2022 | January | 6.5 |
| 2022 | February | 5.8 |
| 2022 | March | 5.7 |
| 2022 | April | 7.2 |
| 2022 | May | 5.8 |
| 2022 | June | 4.2 |
| 2022 | July | 5.3 |
| 2022 | August | 2.4 |
| 2022 | September | 1.2 |
| 2022 | October | 0.9 |
| 2022 | November | 1.1 |
| 2022 | December | 1 |
| 2023 | January | 1.1 |
| 2023 | February | 0.9 |
| 2023 | March | 0.9 |
| 2023 | April | -0.3 |
| 2023 | May | -1.7 |
| 2023 | June | -2.7 |
| 2023 | July | -2.7 |
| 2023 | August | -4.6 |
| 2023 | September | -3.9 |
| 2023 | Oktober | -3.7 |
| 2023 | November | -2.6 |
| 2023 | December | -5.7 |
| 2024 | January | -4.4 |
| 2024 | February | -4.2 |
Mainly more positive about the expected output
Manufacturers were mainly more positive about expected output for the next three months. They were also less negative about the current stocks of finished products, but more negative about order positions.
One component indicator was positive. Manufacturers anticipating an increase in output over the next three months outnumber those expecting a decrease.
Two component indicators were negative. More manufacturers see their order position as weak rather than strong, given the time of year, and more manufacturers describe their current stock of finished products as large rather than small.
| February (balance % positive answers and % negative answers) | January (balance % positive answers and % negative answers) | |
|---|---|---|
| Producer confidence | -4.2 | -4.4 |
| Expected output | 4.6 | 1.8 |
| Assessment of stocks of finished products | -5.3 | -6.4 |
| Assessment of order-book levels | -11.9 | -8.5 |
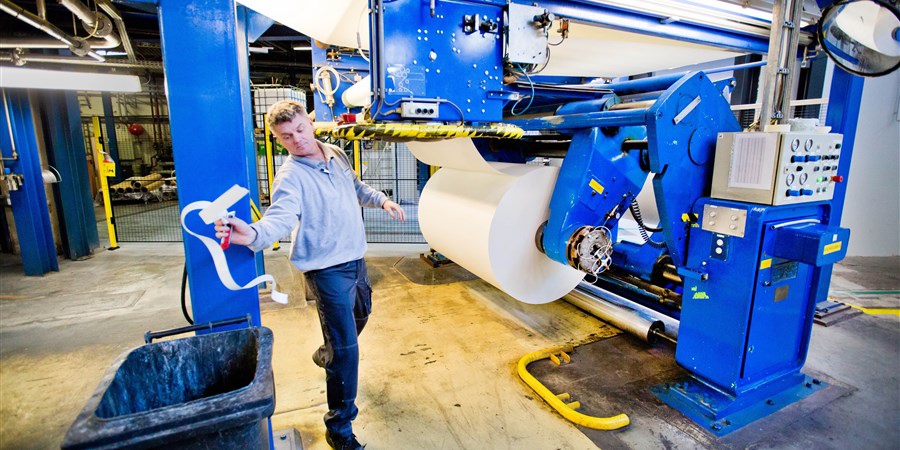
Producer confidence most positive in the paper and printing industry
Producer confidence improved in most manufacturing sectors in February. Producer confidence in the paper and printing industry improved by the most, and confidence in that sector was also the highest. Producer confidence in the electrical and machinery industry deteriorated, with manufacturers more negative about their order position, in particular.
| February (average of the component questions) | January (average of the component questions) | |
|---|---|---|
| Paper and printing | 1.6 | -11.2 |
| Petroleum and chemicals | -1.7 | -8.1 |
| Electrotechnical products and machinery | -2.1 | 6.2 |
| Metal | -5.5 | -12.1 |
| Food, beverages, tobacco | -6.5 | -4.2 |
| Transport equipment | -7 | -13.1 |
| Textiles, clothes, leather | -8.5 | -5.3 |
| Timber and building materials | -20.2 | -20.6 |
Manufacturing output down by over 3 percent in December
In December 2023, the average daily output of the Dutch manufacturing sector was 3.3 percent lower than in December 2022. Output also contracted year on year in the preceding months of 2023. After adjustments for seasonal and working-day effects, manufacturing output rose by 6.8 percent in December relative to November.
As of January 2024, a number of changes have been made to producer confidence. Producer confidence and the component indicators are no longer corrected for insufficient objective assessment (bias) by the producer. This causes a level shift (decrease) for the entire series. In addition, the figures have been recalculated from January 2012 using a different weighting method. The seasonal adjustment method has also been improved.
Sources
Related items
- Dossier - Business cycle