Material efficiency not enough to reduce CO2 emissions
Less CO₂emissions beyond 2010
Between 1970 and 2010, CO₂ emissions by the Dutch economy increased by 50 percent due to strong economic growth. Carbonemissions only dropped temporarily in the early 1980s due to an economic dip. It was only from 2010 onwards that CO₂ emissions began to decrease steadily. The sharp decline in 2020 was partly due to the effects of measures taken as part of the coronavirus crisis. After a slight increase in 2021, CO₂ emissions continued to drop in 2022. The CBS analysis focuses on the period until 2020. On balance, CO₂ emissions increased by just over 30 megatonnes over this 50-year period.| Jaar | CO2 emissions (1970=100) |
|---|---|
| 1970 | 100.00 |
| 1971 | 102.63 |
| 1972 | 105.27 |
| 1973 | 107.90 |
| 1974 | 110.54 |
| 1975 | 113.17 |
| 1976 | 116.41 |
| 1977 | 119.65 |
| 1978 | 122.88 |
| 1979 | 126.12 |
| 1980 | 129.36 |
| 1981 | 127.61 |
| 1982 | 125.87 |
| 1983 | 124.12 |
| 1984 | 122.37 |
| 1985 | 120.62 |
| 1986 | 121.67 |
| 1987 | 122.72 |
| 1988 | 123.77 |
| 1989 | 124.82 |
| 1990 | 125.87 |
| 1991 | 131.99 |
| 1992 | 132.37 |
| 1993 | 132.88 |
| 1994 | 134.59 |
| 1995 | 136.30 |
| 1996 | 142.87 |
| 1997 | 139.69 |
| 1998 | 140.68 |
| 1999 | 138.47 |
| 2000 | 140.20 |
| 2001 | 143.91 |
| 2002 | 143.38 |
| 2003 | 145.64 |
| 2004 | 147.59 |
| 2005 | 145.99 |
| 2006 | 141.56 |
| 2007 | 143.14 |
| 2008 | 146.38 |
| 2009 | 143.06 |
| 2010 | 151.15 |
| 2011 | 142.61 |
| 2012 | 141.37 |
| 2013 | 140.87 |
| 2014 | 136.99 |
| 2015 | 141.46 |
| 2016 | 141.39 |
| 2017 | 139.09 |
| 2018 | 136.39 |
| 2019 | 133.58 |
| 2020* | 121.30 |
| *Provisional figures | |
Economic growth had largest impact on CO₂ emissions
Economic growth had the largest impact on CO₂ emissions, particularly in the period up to 2010. Manufacturing output grew by over 2 percent per year on average, reaching a gross production value of more than 1,400 billion euros by 2020. This output increase, along with higher consumption, could have led to over 200 megatonnes of additional emissions without other influencing factors.This was because during the same period, there was also a shift in activities from agriculture and industry to services. The share of agriculture and manufacturing in gross production declined from 30 percent in 1970 to 25 percent in 2020. Outsourcing of activities by industrial enterprises to other countries played a role in this decline. Moreover, service sectors tend to have lower emission intensity. As a result, the increasingly service-based economy had a dampening effect of nearly 40 megatonnes on CO₂ emissions.
Efficient material play an increasingly smaller role in reducing carbon emissions
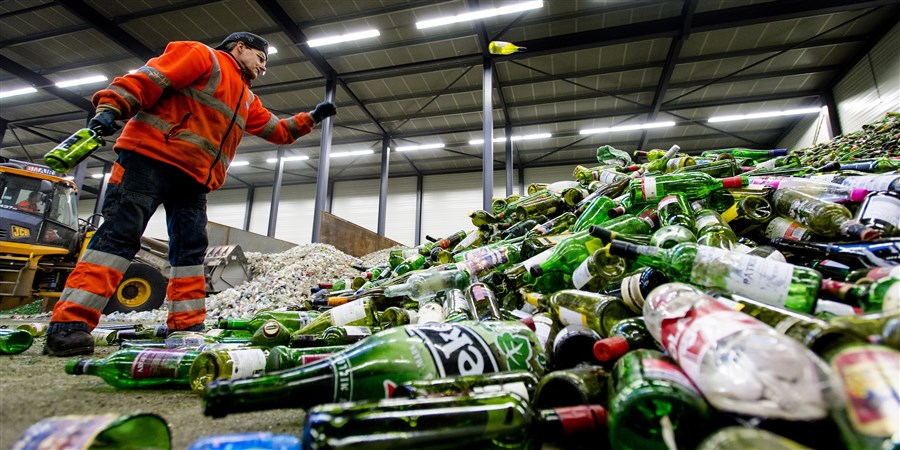
Reduced material consumption by businesses and households has also helped reduce CO₂ emissions. Less consumption of materials means fewer emissions in the production chain. In 1970, material use was still nearly 1.2 kg of materials per euro of output in agriculture and manufacturing, whereas 50 years later it had dropped to less than 0.9 kg per euro. Recycling, i.e. the use of secondary raw materials, has helped reduce emissions as well. The share of primary materials in the production process decreased from 93 to 84 percent. Finally, less consumption of materials by households also leads to fewer emissions, for example by reducing the need to incinerate waste. In total, reducing material use had a moderating impact of nearly 120 megatonnes over half a century. However, this effect was particularly subtantial up to and including 2010. From 2011 onwards, the impact of smarter material use became much smaller. The underlying factors (more efficient material use, recycling rates and material use per capita) did not bring more substantial improvements in this latter period.Energy savings and renewable energy mitigated emissions after 2010
Energy use is closely linked to CO₂ emissions. Over the period 1971-2020, energy consumption per capita fell from over 110 to 100 GJ, a decline that limited emissions by nearly 30 megatonnes. From 2011 until 2020, lower consumption of fossil energy in particular was the primary reason behind the drop in carbon emissions.
Between 1970 and 2010, there was hardly any shift from fossil energy to renewable energy sources. Businesses and households remained dependent on gas and other fossil energy carriers for a long time. It was only after 2010 that an acceleration could be observed in the production and consumption of renewable energy, resulting in a moderating effect on CO₂ emissions.
| Samenhang met verandering CO2-uitstoot | megatonnes (megatonnes) |
|---|---|
| Change in CO2 emissions | 30.2 |
| Economic growth | |
| Shift to services | -38.9 |
| Change in material efficiency | -53.1 |
| Secundary raw materials | -17.9 |
| Material input per capita | -47.8 |
| Energy consumption per capita | -28.7 |
| Decarbonisation of energy mix | 5.0 |
The CBS analysis focuses on annual changes. For example, 1971 represents the change between 1970 and 1971. These annual changes add up over the entire period. The total change for CO₂ emissions, for example, is 30 megatonnes. The analysis breaks down the change in CO2 emissions into the various factors, which add up to 30 megatonnes.
| periode | Change in CO2 emissions (megatonnes) | Economic growth and sectoral shift (megatonnes) | Change in material use and material mix (megatonnes) | Change in energy use and energy mix (megatonnes) |
|---|---|---|---|---|
| 1971-1980 | 41.6 | 48.8 | -35.4 | 28.3 |
| 1981-1995 | 9.8 | 53.7 | -37.4 | -6.5 |
| 1996-2010 | 21.1 | 51.5 | -37.0 | 6.5 |
| 2011-2020 | -42.3 | 18.7 | -9.0 | -52.0 |
The CBS analysis focuses on annual changes. For example, 1971 represents the change between 1970 and 1971. These annual changes add up over the entire period. The total change over the period 1971-1980 for CO₂ emissions, for example, is over 40 megatonnes. The analysis breaks down the change in carbon emissions into the various factors, which add up to 40 megatonnes.
Experimental research
The results of this study are based on an experimental decomposition analysis developed by CBS and Eurostat. The decomposition analysis quantifies the relationship between the change in a variable, in this study CO₂ emissions, and factors that may be involved in this change. De method used will be further developed over time.Sources
- Discussion paper - Index Decomposition Analyses on changes in CO2 emissions