Inflation -0.4% in October, according to flash estimate; 5.1% excluding energy

The negative inflation in October is entirely due to the fact that energy prices were extremely high in October 2022. Excluding energy, inflation amounted to 5.1 percent according to the flash estimate. It stood at 5.5 percent in September. In the first half of 2023, inflation excluding energy and motor fuels was above the current level, peaking at 8.1 percent in February and March.
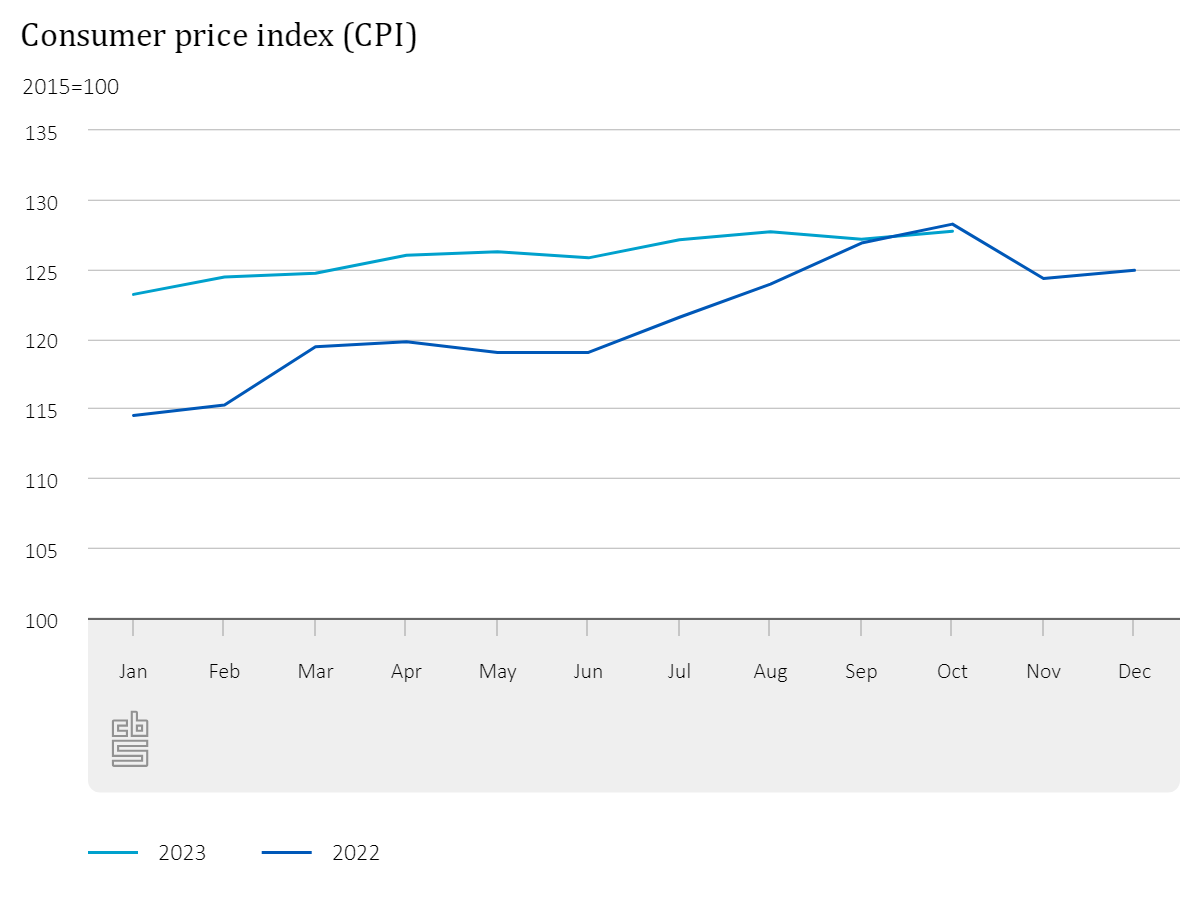
The drop in inflation does not mean that prices fell in October 2023 compared to September 2023. The CPI also gives insight into the price development compared to the previous month. According to the flash estimate, consumer prices were 0.5 percent higher in October compared to September.
The regular consumer price index (CPI) figures for October will be published on 7 November.
| year | month | Inflation (year-on-year % change of the CPI) | Inflation excluding energy and motor fuels (year-on-year % change of the CPI) |
|---|---|---|---|
| 2018 | January | 1.5 | 1.2 |
| 2018 | February | 1.2 | 1 |
| 2018 | March | 1 | 0.8 |
| 2018 | April | 1.1 | 0.8 |
| 2018 | May | 1.7 | 1.2 |
| 2018 | June | 1.7 | 1.1 |
| 2018 | July | 2.1 | 1.4 |
| 2018 | August | 2.1 | 1.4 |
| 2018 | September | 1.9 | 1.2 |
| 2018 | October | 2.1 | 1.5 |
| 2018 | November | 2 | 1.6 |
| 2018 | December | 2 | 1.6 |
| 2019 | January | 2.2 | 1.7 |
| 2019 | February | 2.6 | 2 |
| 2019 | March | 2.8 | 2.2 |
| 2019 | April | 2.9 | 2.2 |
| 2019 | May | 2.4 | 1.8 |
| 2019 | June | 2.7 | 2.2 |
| 2019 | July | 2.5 | 2.3 |
| 2019 | August | 2.8 | 2.7 |
| 2019 | September | 2.6 | 2.5 |
| 2019 | October | 2.7 | 2.6 |
| 2019 | November | 2.6 | 2.3 |
| 2019 | December | 2.7 | 2.3 |
| 2020 | January | 1.8 | 2.1 |
| 2020 | February | 1.6 | 2 |
| 2020 | March | 1.4 | 2.2 |
| 2020 | April | 1.2 | 2.3 |
| 2020 | May | 1.2 | 2.4 |
| 2020 | June | 1.6 | 2.6 |
| 2020 | July | 1.7 | 2.6 |
| 2020 | August | 0.7 | 1.5 |
| 2020 | September | 1.1 | 1.9 |
| 2020 | October | 1.2 | 2.1 |
| 2020 | November | 0.8 | 1.7 |
| 2020 | December | 1 | 1.8 |
| 2021 | January | 1.6 | 2.1 |
| 2021 | February | 1.8 | 2 |
| 2021 | March | 1.9 | 1.7 |
| 2021 | April | 1.9 | 1.3 |
| 2021 | May | 2.1 | 1.5 |
| 2021 | June | 2 | 1.4 |
| 2021 | July | 1.4 | 0.5 |
| 2021 | August | 2.4 | 1.5 |
| 2021 | September | 2.7 | 1.5 |
| 2021 | October | 3.4 | 1.6 |
| 2021 | November | 5.2 | 2.3 |
| 2021 | December | 5.7 | 2.4 |
| 2022 | January | 6.4 | 2.7 |
| 2022 | February | 6.2 | 2.9 |
| 2022 | March | 9.7 | 3.1 |
| 2022 | April | 9.6 | 4.1 |
| 2022 | May | 8.8 | 4.4 |
| 2022 | June | 8.6 | 4.7 |
| 2022 | July | 10.3 | 5.7 |
| 2022 | August | 12 | 6 |
| 2022 | September | 14.5 | 6.5 |
| 2022 | October | 14.3 | 6.9 |
| 2022 | November | 9.9 | 6.8 |
| 2022 | December | 9.6 | 7.5 |
| 2023 | January | 7.6 | 7.7 |
| 2023 | February | 8 | 8.1 |
| 2023 | March | 4.4 | 8.1 |
| 2023 | April | 5.2 | 7.8 |
| 2023 | May | 6.1 | 7.9 |
| 2023 | June | 5.7 | 7.2 |
| 2023 | July | 4.6 | 6.8 |
| 2023 | August | 3 | 6.4 |
| 2023 | September | 0.2 | 5.5 |
| 2023 | October | -0.4 | 5.1 |
Short-term price trends
Not only does the CPI give insight into the price development relative to one year previously (inflation) but also compared to the previous month. According to the flash estimate, consumer prices rose by 0.5 percent in October 2023 relative to September 2023.
A side note to a comparison between two different months in the year is that the seasonal influence must be taken into account. For example, airline tickets are more expensive in holiday months than in months outside the holiday season. Prices are temporarily higher then, but it is not a structural price increase. Due to these seasonal influences, month-on-month developments are often more volatile than year-on-year developments.
Major influence of energy price developments on inflation
The price development of energy (gas, electricity and district heating) has long had a major impact on the course of the inflation rate. This is mainly due to the high prices in the previous year. Energy prices in the CPI soared in the second half of 2022, peaking in October 2022. In part due to this, a very high inflation rate was measured in that period. Energy prices in the CPI are now considerably lower than they were in 2022. As inflation is measured as the change in prices on the same month of the previous year, inflation is now lower.
As of June 2023, CBS has adopted a new method to measure and incorporate energy prices in the CPI. On 30 June, CBS published a background article explaining in more detail what the change means for the CPI, the inflation rate and the use of the CPI for indexation purposes.
Price development of product groups
In addition to the inflation rate, CBS also publishes the price development of a number of product groups as part of its flash estimate. These product groups are aggregations of expenditure categories on a particular theme, such as all services. The price development of all categories in the CPI will be published on 7 November.
| October 2023 (%) | September 2023 (%) | |
|---|---|---|
| All items | -0.4 | 0.2 |
| Non-energy industrial goods | 3.4 | 4.4 |
| Energy including motor fuels | -40.1 | -38.2 |
| Food, beverages and tobacco | 8.7 | 10.0 |
| Services | 4.7 | 4.6 |
HICP flash estimate
As of 1996, CBS publishes two different inflation rates. One based on the Consumer Price Index (CPI) and one on the Harmonised Index of Consumer Prices (HICP). According to the HICP flash estimate, inflation stood at -1.0 percent in October. In September, it was -0.3 percent.
In order to facilitate comparison between countries, EU member states calculate a consumer price index according to internationally agreed definitions and methods. Eurostat calculates the inflation rates for the euro area and the European Union based on these harmonised indices (HICP) from all EU countries. The European Central Bank (ECB) uses the HICP to formulate its monetary policies for the euro area. In addition, most countries produce their own national consumer price index.
For the Netherlands, the main difference between the CPI and the HICP is that, unlike the CPI, the HICP does not take into account the costs related to home ownership. In the CPI, these costs are calculated based on the development of housing rents. However, this is not the only difference. The differences are further explained in another publication.
Sources
- StatLine CPI - Consumer prices; price index 2015=100
- StatLine HICP - Consumer prices; European harmonised price index 2015=100 (HICP)
- Article - Flash estimate of the consumer price index (CPI)
- Article - Differences between consumer price figures
- Dossier - Business cycle