11 percent of energy consumption from renewable sources in 2020
Total renewable energy consumption amounted to 219 petajoules (PJ) last year, i.e. 19 percent up on 2019. Gross final energy consumption stood at nearly 2,000 PJ in 2020, around 100 PJ less than in the previous year. This decline in gross final consumption also contributed to the increased share of renewable energy. Gross final energy consumption comprises electricity, transport fuels and energy for heating buildings and processes in manufacturing. Energy consumption for transport declined in particular, due to less traffic in 2020 partly as a result of far-reaching measures to combat the coronavirus crisis.
At EU level, it was agreed that the share of renewable energy in the Netherlands must be 14 percent by the year 2020. In addition to domestic sources, renewable energy can also be purchased from other countries (via so-called statistical transfers). Based on these provisional figures for 2020, approximately 16 TWh (billion kWh) would need to be transferred from abroad in order to achieve the agreed target of 14 percent. In June 2020, the Netherlands entered into an agreement with Denmark for the transfer of 8 to 16 TWh of renewable energy.
| Jaartal | Biomass (% of gross final energy consumption) | Wind energy (% of gross final energy consumption) | Solar energy (% of gross final energy consumption) | Other1) (% of gross final energy consumption) |
|---|---|---|---|---|
| 2000 | 1.45 | 0.13 | 0.02 | 0.02 |
| 2001 | 1.49 | 0.14 | 0.03 | 0.02 |
| 2002 | 1.62 | 0.17 | 0.03 | 0.03 |
| 2003 | 1.55 | 0.22 | 0.03 | 0.04 |
| 2004 | 1.69 | 0.27 | 0.03 | 0.05 |
| 2005 | 2.08 | 0.32 | 0.04 | 0.04 |
| 2006 | 2.28 | 0.40 | 0.04 | 0.06 |
| 2007 | 2.68 | 0.51 | 0.04 | 0.07 |
| 2008 | 2.84 | 0.62 | 0.04 | 0.10 |
| 2009 | 3.36 | 0.73 | 0.05 | 0.13 |
| 2010 | 3.03 | 0.69 | 0.05 | 0.15 |
| 2011 | 3.51 | 0.78 | 0.06 | 0.18 |
| 2012 | 3.56 | 0.81 | 0.08 | 0.21 |
| 2013 | 3.44 | 0.88 | 0.12 | 0.25 |
| 2014 | 3.85 | 1.04 | 0.19 | 0.34 |
| 2015 | 3.80 | 1.20 | 0.25 | 0.41 |
| 2016 | 3.60 | 1.44 | 0.33 | 0.46 |
| 2017 | 3.87 | 1.64 | 0.43 | 0.52 |
| 2018 | 4.35 | 1.70 | 0.68 | 0.61 |
| 2019 | 5.16 | 1.85 | 0.97 | 0.79 |
| 2020 | 6.02 | 2.54 | 1.51 | 0.99 |
| 1)Hydropower, geothermal energy, aerothermal energy | ||||
Substantial increase in wind and solar power capacity
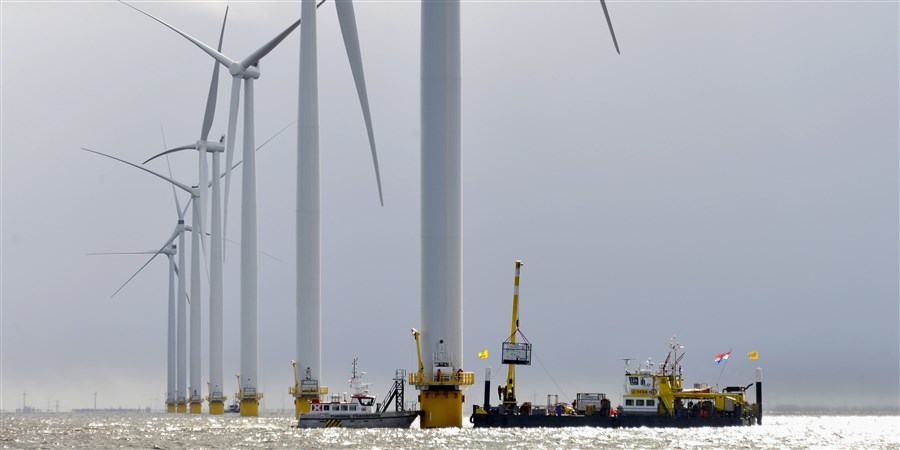
Wind energy consumption rose by 29 percent to 50 PJ. The main reason is the increased installed capacity of offshore wind turbines with the realisation of a new wind farm near Borssele. Last year, more onshore wind turbines were installed as well. Total wind turbine capacity increased from 4,500 megawatts (MW) at the end of 2019 to 6,600 MW at the end of 2020.
In 2020, solar energy consumption (for electricity and heat) rose by 47 percent to 30 PJ. Here as well, new solar parks played the most important role. Another record increase was achieved in the total installed capacity of solar panels for electricity, namely from 7,200 MW in 2019 to slightly over 10,000 MW in 2020.
| Jaar | Onshore wind energy (petajoules) | Offshore wind energy (petajoules) | Solar energy (petajoules) |
|---|---|---|---|
| 2011 | 14.34 | 2.67 | 1.42 |
| 2012 | 14.96 | 2.82 | 1.76 |
| 2013 | 16.68 | 2.65 | 2.58 |
| 2014 | 18.22 | 2.70 | 3.74 |
| 2015 | 21.17 | 3.73 | 5.13 |
| 2016 | 21.75 | 8.36 | 6.91 |
| 2017 | 22.56 | 12.15 | 9.08 |
| 2018 | 23.68 | 12.43 | 14.51 |
| 2019* | 26.74 | 12.04 | 20.42 |
| 2020* | 32.25 | 17.95 | 29.99 |
| * provisional figures | |||
Energy consumption from biomass increased
At 54 percent, biomass is the single largest source of renewable energy; consumption rose by 10 percent to 119 PJ in 2020, largely due to the increased use of biomass at coal-fired power stations. The use of biogas and solid and liquid biomass in boilers at companies was up as well.
Electricity and heat generation from co-firing in coal plants increased from 8 to 20 PJ. The share of biomass in coal plants rose from 10 percent in 2019 to 39 percent in 2020. Subsidies and higher carbon prices supported this increase.
Consumption of biofuels for transport declined from 28 PJ in 2019 to 24 PJ in 2020, despite a higher mandatory renewable energy target for transportation that was imposed on suppliers of motor fuels. The main explanation for this decline is that motor fuel suppliers delivered substantial volumes (10 PJ) of bio-based transport fuels to international shipping in 2020; deliveries that counted towards their mandatory target but not towards the share of renewable energy according to the EU Renewable Energy Directive.
A large part of the bio-based transport fuels that are put on the Dutch market have been produced from used cooking oil and the raw materials in recycled biofuels for transport come from around the world, as reported by the Dutch Emissions Authority.
| Categorie | 2020* (petajoules) | 2019 (petajoules) |
|---|---|---|
| Liquid biofuels for transport | 24.33 | 28.44 |
| Auxiliary and co-combustion of biomass in power plants | 19.72 | 7.93 |
| Waste incineration plants | 17.07 | 16.65 |
| Biomass households | 16.17 | 16.28 |
| Biomass boilers at companies, CHP | 14.76 | 14.10 |
| Biogas | 13.90 | 12.46 |
| Biomass boilers at companies, only heat | 13.33 | 12.56 |
| * provisional figures | ||
Sources
- StatLine - Renewable energy; final use
Related items
- News release - Renewable energy consumption up by 16 percent
- Government of the Netherlands - Agreement for Statistical Transfer of Energy from renewable sources