Electricity production 14 percent up in Q3
Net electricity production in Q3 was the highest ever measured in any third quarter over the period 2014-2020. Electricity production is marked by a strong seasonal pattern. Usually, more electricity is generated in the first and fourth quarters than in second and third quarters. Production is closely linked to both domestic and foreign electricity demand. In Q2, domestic consumption was down by 7 percent year-on-year, partly due to the impact of the measures taken against coronavirus. However, it bounced back to around the same level as one year previously in Q3.
| Jaar | Kwartaal | Net electricity production (bn kWh) | Consumption (bn kWh) |
|---|---|---|---|
| 2014 | Q1 | 24.765 | 28.521 |
| 2014 | Q2 | 23.12 | 25.724 |
| 2014 | Q3 | 23.148 | 25.953 |
| 2014 | Q4 | 28.278 | 28.905 |
| 2015 | Q1 | 29.016 | 28.925 |
| 2015 | Q2 | 22.503 | 25.444 |
| 2015 | Q3 | 24.741 | 26.303 |
| 2015 | Q4 | 29.642 | 28.714 |
| 2016 | Q1 | 28.877 | 28.989 |
| 2016 | Q2 | 23.893 | 25.829 |
| 2016 | Q3 | 25.619 | 26.297 |
| 2016 | Q4 | 32.645 | 29.397 |
| 2017 | Q1 | 31.354 | 29.151 |
| 2017 | Q2 | 25.063 | 25.947 |
| 2017 | Q3 | 25.346 | 26.615 |
| 2017 | Q4 | 31.704 | 29.844 |
| 2018 | Q1 | 30.88 | 30.161 |
| 2018 | Q2 | 23.116 | 26.582 |
| 2018 | Q3 | 26.606 | 27.254 |
| 2018 | Q4 | 30.444 | 29.683 |
| 2019 | Q1 | 32.566 | 29.873 |
| 2019 | Q2 | 26.059 | 26.588 |
| 2019 | Q3 | 26.962 | 26.732 |
| 2019 | Q4 | 32.274 | 30.189 |
| 2020 | Q1 | 30.856 | 29.698 |
| 2020 | Q2 | 25.939 | 24.893 |
| 2020 | Q3 | 30.751 | 26.599 |
Electricity imports from Belgium down, exports to Belgium and Germany up
In Q3 2020, the Netherlands imported 3.7 billion kWh and exported 6.7 billion kWh. On balance, this resulted in net exports of 3.0 billion kWh, the highest balance measured since 1976. The Netherlands is generally a net importer of electricity. It has relatively many natural gas-fired power plants that compete with foreign power plants. The price of gas is currently relatively low and gas-fired power plants emit less CO2 than coal-fired power plants. Gas-fired plants are therefore less affected by the relatively high carbon price.
| Jaar | Kwartaal | Net imports (bn kWh) | Imports (bn kWh) | Exports (displayed as a negative value) (bn kWh) |
|---|---|---|---|---|
| 2014 | Q1 | 5.052 | 9.052 | -4.000 |
| 2014 | Q2 | 3.765 | 8.206 | -4.441 |
| 2014 | Q3 | 3.972 | 7.764 | -3.792 |
| 2014 | Q4 | 1.937 | 7.832 | -5.895 |
| 2015 | Q1 | 1.292 | 7.532 | -6.240 |
| 2015 | Q2 | 4.179 | 8.455 | -4.276 |
| 2015 | Q3 | 2.808 | 8.094 | -5.286 |
| 2015 | Q4 | 0.470 | 6.680 | -6.210 |
| 2016 | Q1 | 1.541 | 6.032 | -4.491 |
| 2016 | Q2 | 3.215 | 6.917 | -3.702 |
| 2016 | Q3 | 1.963 | 6.190 | -4.227 |
| 2016 | Q4 | -1.804 | 5.119 | -6.923 |
| 2017 | Q1 | -0.781 | 5.023 | -5.804 |
| 2017 | Q2 | 2.159 | 6.231 | -4.072 |
| 2017 | Q3 | 2.551 | 5.919 | -3.368 |
| 2017 | Q4 | -0.421 | 5.286 | -5.707 |
| 2018 | Q1 | 0.683 | 5.805 | -5.122 |
| 2018 | Q2 | 4.722 | 7.891 | -3.169 |
| 2018 | Q3 | 1.910 | 6.803 | -4.893 |
| 2018 | Q4 | 0.655 | 6.256 | -5.601 |
| 2019 | Q1 | -1.292 | 4.638 | -5.930 |
| 2019 | Q2 | 1.784 | 5.837 | -4.053 |
| 2019 | Q3 | 1.030 | 5.242 | -4.212 |
| 2019 | Q4 | -0.668 | 4.686 | -5.354 |
| 2020 | Q1 | 0.170 | 5.444 | -5.274 |
| 2020 | Q2 | 0.143 | 5.281 | -5.138 |
| 2020 | Q3 | -2.957 | 3.689 | -6.646 |
Belgian nuclear power plants produced less in the third quarter. As a result, imports from Belgium fell by 2.0 billion kWh in Q3 relative to one year previously. At the same time, exports to Belgium rose by 1.7 billion kWh over this period. Net imports from Belgium therefore declined by 3.7 billion kWh.
Production by German coal plants was down on one year previously, due to the relatively high carbon prices. This boosted exports to Germany by 0.8 billion kWh.
| 2020 (bn kWh) | 2019 (bn kWh) | |
|---|---|---|
| Total imports | 3.688 | 5.242 |
| of which | ||
| Imports from Germany | 1.495 | 1.468 |
| Imports from Belgium | 0.49 | 2.493 |
| . | ||
| Total exports | 6.647 | 4.21 |
| of which | ||
| Exports to Germany | 3.121 | 2.316 |
| Exports to Belgium | 2.016 | 0.281 |
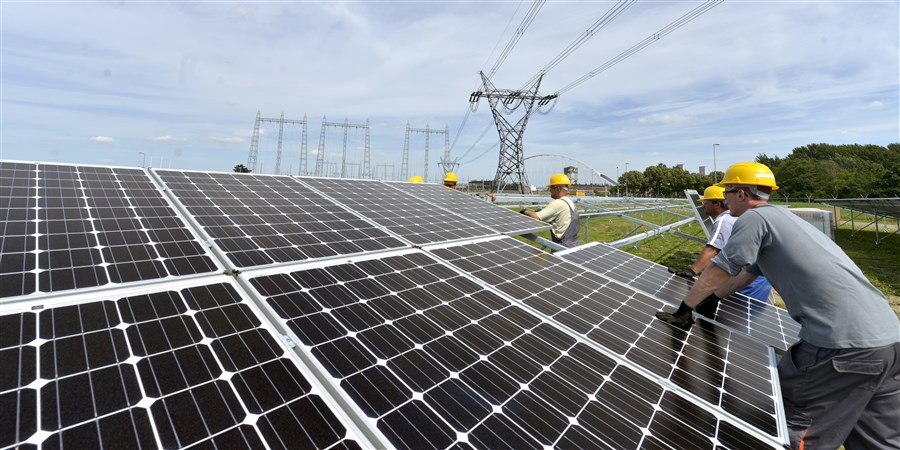
Substantial increase in renewable electricity
In Q3 2020, over 2.2 billion kWh (41 percent) more electricity was produced from renewable sources. Solar and wind power production in particular saw a sharp increase. The main reason for the increase in solar power is greater capacity. As for higher electricity production from wind, the main factors are the commissioning of an offshore wind farm and more favourable wind conditions on land. Electricity generation from natural gas was up by 1.7 billion kWh (10 percent) in Q3 year-on-year. Production from coal was 24 million kWh (1 percent) down on 2019.
| Jaar | Kwartaal | Natural gas (bn kWh) | Coal (bn kWh) | Other (bn kWh) | Renewable (bn kWh) |
|---|---|---|---|---|---|
| 2015 | Q1 | 13.584 | 10.208 | 1.929 | 3.295 |
| 2015 | Q2 | 7.988 | 9.978 | 1.646 | 2.891 |
| 2015 | Q3 | 9.434 | 10.162 | 2.159 | 2.986 |
| 2015 | Q4 | 13.757 | 9.802 | 2.204 | 3.879 |
| 2016 | Q1 | 13.418 | 9.564 | 2.06 | 3.835 |
| 2016 | Q2 | 10.012 | 9.191 | 1.549 | 3.141 |
| 2016 | Q3 | 12.076 | 8.164 | 2.085 | 3.294 |
| 2016 | Q4 | 15.985 | 10.739 | 2.072 | 3.849 |
| 2017 | Q1 | 15.165 | 9.735 | 2.106 | 4.348 |
| 2017 | Q2 | 12.234 | 7.684 | 1.35 | 3.795 |
| 2017 | Q3 | 12.968 | 6.925 | 1.915 | 3.538 |
| 2017 | Q4 | 16.388 | 8.273 | 1.962 | 5.081 |
| 2018 | Q1 | 14.922 | 9.022 | 2.066 | 4.87 |
| 2018 | Q2 | 11.059 | 6.347 | 1.569 | 4.141 |
| 2018 | Q3 | 14.51 | 6.464 | 1.44 | 4.192 |
| 2018 | Q4 | 16.124 | 7.379 | 1.908 | 5.033 |
| 2019 | Q1 | 18.303 | 7.045 | 1.845 | 5.373 |
| 2019 | Q2 | 15.366 | 3.979 | 1.44 | 5.274 |
| 2019 | Q3 | 17.604 | 2.305 | 1.82 | 5.233 |
| 2019 | Q4 | 18.703 | 5.84 | 1.969 | 5.762 |
| 2020 | Q1 | 18.63 | 2.687 | 1.984 | 7.555 |
| 2020 | Q2 | 15.587 | 1.355 | 1.594 | 7.403 |
| 2020 | Q3 | 19.338 | 2.281 | 1.745 | 7.387 |