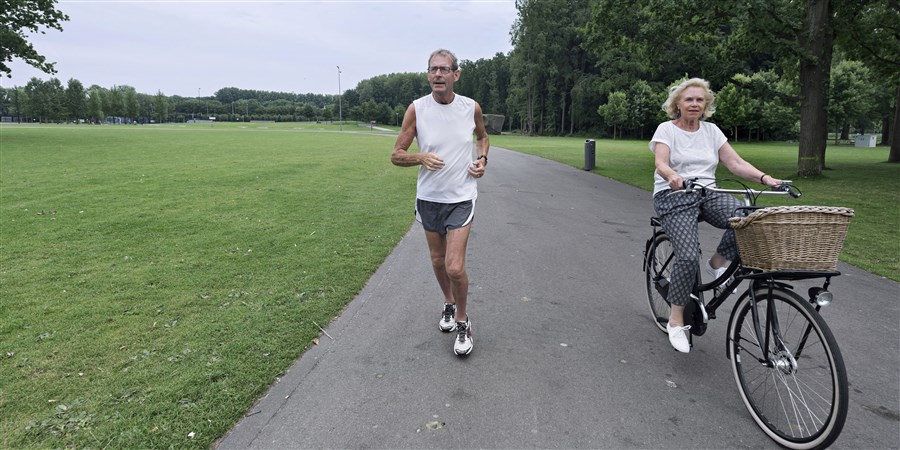
Well-being differs between men and women

© Hollandse Hoogte / David Rozing
On a number of aspects, the well-being of men in the Netherlands is higher than that of women. Relatively more than women trust other people and men are more likely to rate their own health as good or very good. Women do better than men on other aspects: they do more voluntary work, have more contact with family and friends and are less likely to be overweight. These and other aspects of the distribution of well-being are described in Statistics Netherlands’ (CBS) Monitor of Well-being & the Sustainable Development Goals 2020.
Well-being comprises more than the narrow concept of economy and income. It also encompasses factors like health, education level and quality of the living environment. Together these factors constitute a broader concept of well-being. This broader well-being was not distributed equally across the Dutch population in 2019. People with higher education and people with a native Dutch background do better than average on many well-being indicators, while those with lower education levels and a migrant background are more likely to be in a less favourable position. Women do better than men on five indicators, but men do better than women on five others.

Baseline for pre-corona situation

The data in the Monitor of Well-being & the SDGs 2020 do not reflect the impact of the coronavirus crisis. The same is true of the figures on the distribution of well-being. Almost all figures on the distribution of well-being refer to 2019. This means they can be seen as a baseline on the eve of the coronavirus outbreak. Next year and in subsequent years the same indicators can be used to analyse whether – and if so to what extent – the distribution of well-being will shift during and after this unprecedented crisis situation.

Distribution of well-being
Indicators on which certain population groups have a significantly higher (green) or lower (red) well-being than the national average (grey)
Sorted by colour
Sorted by indicator

Sex

Men, Overweight: lower well-being than the national average
Men, Satisfaction With Leisure Time: lower well-being than the national average
Men, Weekly Contact With Family, Friends And/or Neighbours: lower well-being than the national average
Men, Voluntary Work: lower well-being than the national average
Men, Crime Victim: lower well-being than the national average
Men, Satisfaction With Life: well-being does not deviate from the national average
Men, Higher Education: well-being does not deviate from the national average
Men, Long-term Unemployment: well-being does not deviate from the national average
Men, Satisfaction With Work: well-being does not deviate from the national average
Men, Satisfaction With Commuting Time: well-being does not deviate from the national average
Men, One Or More Housing Defects: well-being does not deviate from the national average
Men, Satisfaction With Housing: well-being does not deviate from the national average
Men, Trust In Institutions: well-being does not deviate from the national average
Men, Often Experiences Environmental Pollution In Own Neighbourhood: well-being does not deviate from the national average
Men, Personal Well-being: higher well-being than the national average
Men, Good Or Very Good Health: higher well-being than the national average
Men, Paid Work: higher well-being than the national average
Men, Trust In Other People: higher well-being than the national average
Men, Often Feels Unsafe In Own Neighbourhood: higher well-being than the national average
Men, Median Household Income: higher well-being than the national average
Women, Personal Well-being: lower well-being than the national average
Women, Good Or Very Good Health: lower well-being than the national average
Women, Paid Work: lower well-being than the national average
Women, Trust In Other People: lower well-being than the national average
Women, Often Feels Unsafe In Own Neighbourhood: lower well-being than the national average
Women, Satisfaction With Life: well-being does not deviate from the national average
Women, Higher Education: well-being does not deviate from the national average
Women, Long-term Unemployment: well-being does not deviate from the national average
Women, Satisfaction With Work: well-being does not deviate from the national average
Women, Satisfaction With Commuting Time: well-being does not deviate from the national average
Women, One Or More Housing Defects: well-being does not deviate from the national average
Women, Satisfaction With Housing: well-being does not deviate from the national average
Women, Trust In Institutions: well-being does not deviate from the national average
Women, Often Experiences Environmental Pollution In Own Neighbourhood: well-being does not deviate from the national average
Women, Overweight: higher well-being than the national average
Women, Satisfaction With Leisure Time: higher well-being than the national average
Women, Weekly Contact With Family, Friends And/or Neighbours: higher well-being than the national average
Women, Voluntary Work: higher well-being than the national average
Women, Crime Victim: higher well-being than the national average
Women, Median Household Income: lower well-being than the national average

Age

younger than 25, Median Household Income: lower well-being than the national average
younger than 25, Higher Education: lower well-being than the national average
younger than 25, Paid Work: lower well-being than the national average
younger than 25, Satisfaction With Leisure Time: lower well-being than the national average
younger than 25, One Or More Housing Defects: lower well-being than the national average
younger than 25, Crime Victim: lower well-being than the national average
younger than 25, Satisfaction With Life: well-being does not deviate from the national average
younger than 25, Satisfaction With Work: well-being does not deviate from the national average
younger than 25, Satisfaction With Commuting Time: well-being does not deviate from the national average
younger than 25, Satisfaction With Housing: well-being does not deviate from the national average
younger than 25, Weekly Contact With Family, Friends And/or Neighbours: well-being does not deviate from the national average
younger than 25, Voluntary Work: well-being does not deviate from the national average
younger than 25, Trust In Other People: well-being does not deviate from the national average
younger than 25, Often Feels Unsafe In Own Neighbourhood: well-being does not deviate from the national average
younger than 25, Personal Well-being: higher well-being than the national average
younger than 25, Good Or Very Good Health: higher well-being than the national average
younger than 25, Overweight: higher well-being than the national average
younger than 25, Long-term Unemployment: higher well-being than the national average
younger than 25, Trust In Institutions: higher well-being than the national average
younger than 25, Often Experiences Environmental Pollution In Own Neighbourhood: higher well-being than the national average
25-34, Satisfaction With Life: lower well-being than the national average
25-34, Satisfaction With Work: lower well-being than the national average
25-34, Satisfaction With Commuting Time: lower well-being than the national average
25-34, Satisfaction With Leisure Time: lower well-being than the national average
25-34, One Or More Housing Defects: lower well-being than the national average
25-34, Satisfaction With Housing: lower well-being than the national average
25-34, Voluntary Work: lower well-being than the national average
25-34, Crime Victim: lower well-being than the national average
25-34, Often Feels Unsafe In Own Neighbourhood: lower well-being than the national average
25-34, Median Household Income: well-being does not deviate from the national average
25-34, Weekly Contact With Family, Friends And/or Neighbours: well-being does not deviate from the national average
25-34, Often Experiences Environmental Pollution In Own Neighbourhood: well-being does not deviate from the national average
25-34, Personal Well-being: higher well-being than the national average
25-34, Good Or Very Good Health: higher well-being than the national average
25-34, Overweight: higher well-being than the national average
25-34, Higher Education: higher well-being than the national average
25-34, Paid Work: higher well-being than the national average
25-34, Long-term Unemployment: higher well-being than the national average
25-34, Trust In Other People: higher well-being than the national average
25-34, Trust In Institutions: higher well-being than the national average
35-44 , Overweight: lower well-being than the national average
35-44 , Satisfaction With Leisure Time: lower well-being than the national average
35-44 , One Or More Housing Defects: lower well-being than the national average
35-44 , Satisfaction With Housing: lower well-being than the national average
35-44 , Crime Victim: lower well-being than the national average
35-44 , Satisfaction With Life: well-being does not deviate from the national average
35-44 , Personal Well-being: well-being does not deviate from the national average
35-44 , Good Or Very Good Health: well-being does not deviate from the national average
35-44 , Satisfaction With Work: well-being does not deviate from the national average
35-44 , Satisfaction With Commuting Time: well-being does not deviate from the national average
35-44 , Weekly Contact With Family, Friends And/or Neighbours: well-being does not deviate from the national average
35-44 , Often Feels Unsafe In Own Neighbourhood: well-being does not deviate from the national average
35-44 , Often Experiences Environmental Pollution In Own Neighbourhood: well-being does not deviate from the national average
35-44 , Median Household Income: higher well-being than the national average
35-44 , Higher Education: higher well-being than the national average
35-44 , Paid Work: higher well-being than the national average
35-44 , Long-term Unemployment: higher well-being than the national average
35-44 , Voluntary Work: higher well-being than the national average
35-44 , Trust In Other People: higher well-being than the national average
35-44 , Trust In Institutions: higher well-being than the national average
45-54, Personal Well-being: lower well-being than the national average
45-54, Good Or Very Good Health: lower well-being than the national average
45-54, Overweight: lower well-being than the national average
45-54, Satisfaction With Leisure Time: lower well-being than the national average
45-54, Weekly Contact With Family, Friends And/or Neighbours: lower well-being than the national average
45-54, Crime Victim: lower well-being than the national average
45-54, Satisfaction With Life: well-being does not deviate from the national average
45-54, Long-term Unemployment: well-being does not deviate from the national average
45-54, Satisfaction With Commuting Time: well-being does not deviate from the national average
45-54, One Or More Housing Defects: well-being does not deviate from the national average
45-54, Satisfaction With Housing: well-being does not deviate from the national average
45-54, Trust In Institutions: well-being does not deviate from the national average
45-54, Often Feels Unsafe In Own Neighbourhood: well-being does not deviate from the national average
45-54, Often Experiences Environmental Pollution In Own Neighbourhood: well-being does not deviate from the national average
45-54, Median Household Income: higher well-being than the national average
45-54, Higher Education: higher well-being than the national average
45-54, Paid Work: higher well-being than the national average
45-54, Satisfaction With Work: higher well-being than the national average
45-54, Voluntary Work: higher well-being than the national average
45-54, Trust In Other People: higher well-being than the national average
55-64, Personal Well-being: lower well-being than the national average
55-64, Good Or Very Good Health: lower well-being than the national average
55-64, Overweight: lower well-being than the national average
55-64, Higher Education: lower well-being than the national average
55-64, Long-term Unemployment: lower well-being than the national average
55-64, Weekly Contact With Family, Friends And/or Neighbours: lower well-being than the national average
55-64, Trust In Institutions: lower well-being than the national average
55-64, Often Experiences Environmental Pollution In Own Neighbourhood: lower well-being than the national average
55-64, Satisfaction With Life: well-being does not deviate from the national average
55-64, Satisfaction With Work: well-being does not deviate from the national average
55-64, One Or More Housing Defects: well-being does not deviate from the national average
55-64, Voluntary Work: well-being does not deviate from the national average
55-64, Trust In Other People: well-being does not deviate from the national average
55-64, Often Feels Unsafe In Own Neighbourhood: well-being does not deviate from the national average
55-64, Median Household Income: higher well-being than the national average
55-64, Paid Work: higher well-being than the national average
55-64, Satisfaction With Commuting Time: higher well-being than the national average
55-64, Satisfaction With Leisure Time: higher well-being than the national average
55-64, Satisfaction With Housing: higher well-being than the national average
55-64, Crime Victim: higher well-being than the national average
65-74, Good Or Very Good Health: lower well-being than the national average
65-74, Overweight: lower well-being than the national average
65-74, Higher Education: lower well-being than the national average
65-74, Paid Work: lower well-being than the national average
65-74, Long-term Unemployment: lower well-being than the national average
65-74, Trust In Other People: lower well-being than the national average
65-74, Trust In Institutions: lower well-being than the national average
65-74, Often Experiences Environmental Pollution In Own Neighbourhood: lower well-being than the national average
65-74, Personal Well-being: well-being does not deviate from the national average
65-74, Median Household Income: well-being does not deviate from the national average
65-74, Satisfaction With Commuting Time: well-being does not deviate from the national average
65-74, Voluntary Work: well-being does not deviate from the national average
65-74, Satisfaction With Life: higher well-being than the national average
65-74, Satisfaction With Work: higher well-being than the national average
65-74, Satisfaction With Leisure Time: higher well-being than the national average
65-74, One Or More Housing Defects: higher well-being than the national average
65-74, Satisfaction With Housing: higher well-being than the national average
65-74, Weekly Contact With Family, Friends And/or Neighbours: higher well-being than the national average
65-74, Crime Victim: higher well-being than the national average
65-74, Often Feels Unsafe In Own Neighbourhood: higher well-being than the national average
75 and older, Median Household Income: lower well-being than the national average
75 and older, Good Or Very Good Health: lower well-being than the national average
75 and older, Overweight: lower well-being than the national average
75 and older, Voluntary Work: lower well-being than the national average
75 and older, Trust In Other People: lower well-being than the national average
75 and older, Trust In Institutions: lower well-being than the national average
75 and older, Satisfaction With Life: well-being does not deviate from the national average
75 and older, Personal Well-being: well-being does not deviate from the national average
75 and older, Satisfaction With Leisure Time: higher well-being than the national average
75 and older, One Or More Housing Defects: higher well-being than the national average
75 and older, Satisfaction With Housing: higher well-being than the national average
75 and older, Weekly Contact With Family, Friends And/or Neighbours: higher well-being than the national average
75 and older, Crime Victim: higher well-being than the national average
75 and older, Often Feels Unsafe In Own Neighbourhood: higher well-being than the national average
75 and older, Often Experiences Environmental Pollution In Own Neighbourhood: higher well-being than the national average
75 and older, Higher Education: lower well-being than the national average
75 and older, Paid Work: lower well-being than the national average
75 and older, Long-term Unemployment: lower well-being than the national average
75 and older, Satisfaction With Work: lower well-being than the national average
75 and older, Satisfaction With Commuting Time: lower well-being than the national average

Highest completed level of education

Low, Satisfaction With Life: lower well-being than the national average
Low, Personal Well-being: lower well-being than the national average
Low, Median Household Income: lower well-being than the national average
Low, Good Or Very Good Health: lower well-being than the national average
Low, Overweight: lower well-being than the national average
Low, Paid Work: lower well-being than the national average
Low, Long-term Unemployment: lower well-being than the national average
Low, Satisfaction With Work: lower well-being than the national average
Low, Voluntary Work: lower well-being than the national average
Low, Trust In Other People: lower well-being than the national average
Low, Trust In Institutions: lower well-being than the national average
Low, Often Feels Unsafe In Own Neighbourhood: lower well-being than the national average
Low, One Or More Housing Defects: well-being does not deviate from the national average
Low, Satisfaction With Housing: well-being does not deviate from the national average
Low, Weekly Contact With Family, Friends And/or Neighbours: well-being does not deviate from the national average
Low, Often Experiences Environmental Pollution In Own Neighbourhood: well-being does not deviate from the national average
Low, Satisfaction With Commuting Time: higher well-being than the national average
Low, Satisfaction With Leisure Time: higher well-being than the national average
Low, Crime Victim: higher well-being than the national average
Low, Higher Education: lower well-being than the national average
Medium, Personal Well-being: lower well-being than the national average
Medium, Overweight: lower well-being than the national average
Medium, Satisfaction With Work: lower well-being than the national average
Medium, Trust In Other People: lower well-being than the national average
Medium, Trust In Institutions: lower well-being than the national average
Medium, Often Experiences Environmental Pollution In Own Neighbourhood: lower well-being than the national average
Medium, Satisfaction With Life: well-being does not deviate from the national average
Medium, Median Household Income: well-being does not deviate from the national average
Medium, Long-term Unemployment: well-being does not deviate from the national average
Medium, Satisfaction With Leisure Time: well-being does not deviate from the national average
Medium, One Or More Housing Defects: well-being does not deviate from the national average
Medium, Satisfaction With Housing: well-being does not deviate from the national average
Medium, Weekly Contact With Family, Friends And/or Neighbours: well-being does not deviate from the national average
Medium, Crime Victim: well-being does not deviate from the national average
Medium, Often Feels Unsafe In Own Neighbourhood: well-being does not deviate from the national average
Medium, Good Or Very Good Health: higher well-being than the national average
Medium, Paid Work: higher well-being than the national average
Medium, Satisfaction With Commuting Time: higher well-being than the national average
Medium, Voluntary Work: higher well-being than the national average
Medium, Higher Education: lower well-being than the national average
High, Satisfaction With Commuting Time: lower well-being than the national average
High, Satisfaction With Leisure Time: lower well-being than the national average
High, Weekly Contact With Family, Friends And/or Neighbours: lower well-being than the national average
High, Crime Victim: lower well-being than the national average
High, Satisfaction With Housing: well-being does not deviate from the national average
High, Often Experiences Environmental Pollution In Own Neighbourhood: well-being does not deviate from the national average
High, Satisfaction With Life: higher well-being than the national average
High, Personal Well-being: higher well-being than the national average
High, Median Household Income: higher well-being than the national average
High, Good Or Very Good Health: higher well-being than the national average
High, Overweight: higher well-being than the national average
High, Paid Work: higher well-being than the national average
High, Long-term Unemployment: higher well-being than the national average
High, Satisfaction With Work: higher well-being than the national average
High, One Or More Housing Defects: higher well-being than the national average
High, Voluntary Work: higher well-being than the national average
High, Trust In Other People: higher well-being than the national average
High, Trust In Institutions: higher well-being than the national average
High, Often Feels Unsafe In Own Neighbourhood: higher well-being than the national average
High, Higher Education: higher well-being than the national average

Migration background

Native Dutch, Median Household Income: well-being does not deviate from the national average
Native Dutch, Trust In Institutions: well-being does not deviate from the national average
Native Dutch, Satisfaction With Life: higher well-being than the national average
Native Dutch, Personal Well-being: higher well-being than the national average
Native Dutch, Good Or Very Good Health: higher well-being than the national average
Native Dutch, Overweight: higher well-being than the national average
Native Dutch, Higher Education: higher well-being than the national average
Native Dutch, Paid Work: higher well-being than the national average
Native Dutch, Long-term Unemployment: higher well-being than the national average
Native Dutch, Satisfaction With Work: higher well-being than the national average
Native Dutch, Satisfaction With Commuting Time: higher well-being than the national average
Native Dutch, Satisfaction With Leisure Time: higher well-being than the national average
Native Dutch, One Or More Housing Defects: higher well-being than the national average
Native Dutch, Satisfaction With Housing: higher well-being than the national average
Native Dutch, Weekly Contact With Family, Friends And/or Neighbours: higher well-being than the national average
Native Dutch, Voluntary Work: higher well-being than the national average
Native Dutch, Trust In Other People: higher well-being than the national average
Native Dutch, Crime Victim: higher well-being than the national average
Native Dutch, Often Feels Unsafe In Own Neighbourhood: higher well-being than the national average
Native Dutch, Often Experiences Environmental Pollution In Own Neighbourhood: higher well-being than the national average
Western background, Personal Well-being: lower well-being than the national average
Western background, Median Household Income: lower well-being than the national average
Western background, Overweight: lower well-being than the national average
Western background, Paid Work: lower well-being than the national average
Western background, Long-term Unemployment: lower well-being than the national average
Western background, Satisfaction With Work: lower well-being than the national average
Western background, Satisfaction With Commuting Time: lower well-being than the national average
Western background, Weekly Contact With Family, Friends And/or Neighbours: lower well-being than the national average
Western background, Voluntary Work: lower well-being than the national average
Western background, Trust In Other People: lower well-being than the national average
Western background, Crime Victim: lower well-being than the national average
Western background, Often Feels Unsafe In Own Neighbourhood: lower well-being than the national average
Western background, Often Experiences Environmental Pollution In Own Neighbourhood: lower well-being than the national average
Western background, Satisfaction With Life: well-being does not deviate from the national average
Western background, Good Or Very Good Health: well-being does not deviate from the national average
Western background, Satisfaction With Leisure Time: well-being does not deviate from the national average
Western background, One Or More Housing Defects: well-being does not deviate from the national average
Western background, Satisfaction With Housing: well-being does not deviate from the national average
Western background, Trust In Institutions: well-being does not deviate from the national average
Western background, Higher Education: higher well-being than the national average
Non-western background, Satisfaction With Life: lower well-being than the national average
Non-western background, Personal Well-being: lower well-being than the national average
Non-western background, Median Household Income: lower well-being than the national average
Non-western background, Good Or Very Good Health: lower well-being than the national average
Non-western background, Overweight: lower well-being than the national average
Non-western background, Higher Education: lower well-being than the national average
Non-western background, Paid Work: lower well-being than the national average
Non-western background, Long-term Unemployment: lower well-being than the national average
Non-western background, Satisfaction With Work: lower well-being than the national average
Non-western background, Satisfaction With Leisure Time: lower well-being than the national average
Non-western background, One Or More Housing Defects: lower well-being than the national average
Non-western background, Satisfaction With Housing: lower well-being than the national average
Non-western background, Voluntary Work: lower well-being than the national average
Non-western background, Trust In Other People: lower well-being than the national average
Non-western background, Crime Victim: lower well-being than the national average
Non-western background, Often Feels Unsafe In Own Neighbourhood: lower well-being than the national average
Non-western background, Often Experiences Environmental Pollution In Own Neighbourhood: lower well-being than the national average
Non-western background, Satisfaction With Commuting Time: well-being does not deviate from the national average
Non-western background, Weekly Contact With Family, Friends And/or Neighbours: well-being does not deviate from the national average
Non-western background, Trust In Institutions: well-being does not deviate from the national average

Higher educated people rank higher on well-being scale

The distribution of well-being within population groups based on sex, age, education and migration background is measured using a maximum of 20 indicators divided into the themes general well-being, material well-being, health, labour and leisure time, housing, society, security and environment. People with higher education score higher than average on thirteen of these indicators, people with lower levels of education are only higher than average on three indicators. Vice versa, the higher educated score lower than average on four indicators, while those with lower levels of education score below average on twelve indicators.

Women have more social contacts and are less overweight

Women are in a more favourable position than men on five aspects of well-being. Relatively fewer of them report being a victim of crime (excl. cybercrime), they are more likely to do voluntary work and they have more weekly contacts with family and friends and/or neighbours than men. Women are also more satisfied with the amount of leisure time they have than men. And lastly fewer women (40 percent) than men (48 percent) are overweight.

Well-being indicators on which women score favourably, 2019
 MenWomen
Being overweight *48.140.1
Satisfaction with amount of leisure time **72.975.4
Weekly contact with family/friends/neigbours***69.874.6
Voluntary work ***45.547.9
Victim of crime ***14.313.0
* 4 yrs and over ** 18 yrs and over *** 15 yrs and over

Men more often have paid work and higher personal well-being

On five other well-being indicators men score more favourably than women. Men are less likely to feel unsafe in their own neighbourhood, more likely to trust other people and more of them describe their health as good or very good. Relatively more men than women have paid work. And relatively more men than women have a high score on the personal well-being index, a combined measure of well-being in various areas of life. In 2019, 68 percent of men had a high personal well-being score, compared with 62 percent of women.
Well-being indicators on which men score favourably, 2019
 MenWomen
Describes health as good or very good81.276.3
Paid work **73.264.4
Personal well-being index67.661.9
Trust in other people ***63.959.8
Often feels unsafe in own neighbourhood1.11.7
* 18 yrs and over ** 15 to 74 yrs *** 15 yrs and over

Education level is a significant factor

The studies underlying the Monitor of Well-being and the SDG’s 2020 not only examined distribution within groups in the population. It also looked at the cumulative favourable or unfavourable results at individual level, based on data on ten well-being indicators for each person. This revealed that men accumulate positive results slightly more often and negative results slightly less often than women.

In these individual level cumulative favourable and unfavourable results, education level was a prominent factor. People with a low education level very rarely have an accumulation of positive results, while over one third of them have an accumulation of negative results. The situation is very different for those with higher education levels: they often accumulate favourable results.

Accumulation of favourable and unfavourable results for ten well-being indicators

Sex

11.4%
66.2%
22.3%
14.7%
65.2%
20%

Age

9.9%
66.8%
23.2%
9.6%
60.4%
30%
7.9%
64.1%
27.9%
11.5%
63.6%
24.9%
16.5%
62.7%
20.8%
23.9%
66.5%
9.6%
12.2%
84.1%
3.8%

Highest completed level of education

35.1%
61.7%
3.2%
7.7%
81.5%
10.8%
2.5%
49.6%
47.8%

Migration background

11.5%
66.2%
22.3%
14.8%
66%
19.3%
22.6%
62.0%
15.4%

Gender inequality

The results for the Sustainable Development Goal on gender equality (SDG 5) show that in some areas the difference between men and women is diminishing. The wage gap, for example, decreased between 2012 and 2019. On the other hand the number of women in parliament fell and the proportion of senior management positions held by women is much lower than in other EU countries.