Household and farm water usage surged in 2018
| Jaartal | Consumption (million m3 ) |
|---|---|
| 2003 | 815.35 |
| 2004 | 796.16 |
| 2005 | 790.51 |
| 2006 | 800.72 |
| 2007 | 789.36 |
| 2008 | 788.35 |
| 2009 | 788.13 |
| 2010 | 786.20 |
| 2011 | 781.76 |
| 2012 | 782.97 |
| 2013 | 785.30 |
| 2014 | 783.30 |
| 2015 | 793.67 |
| 2016 | 805.25 |
| 2017 | 782.08 |
| 2018 | 837.20 |
| Source: CBS, VEWIN | |
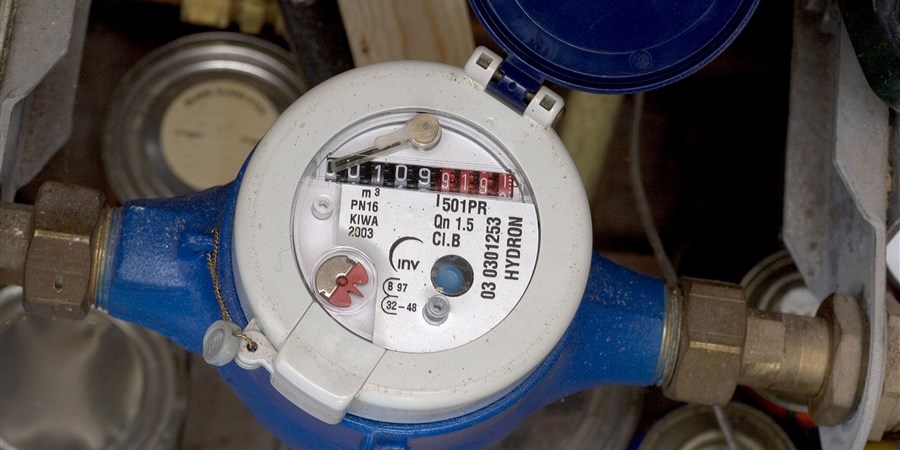
As a result of drought and heat in 2018, drinking water consumption by households rose to 837 million cubic metres year-on-year. There was still a decline of 4 percent over the period 2003-2017 to 782 million cubic metres.
In 2018, per capita consumption of drinking water showed a year-on-year increase of 6.5 percent to 133 litres per day. From 2003 to 2017, household water usage per inhabitant fell by over 9 percent to 125 litres per day.
The decline in water use is mainly due to household appliances becoming ever more economical: for example, washing machines and dishwashers use less water, and toilets are increasingly being equipped with a water-saving low flush system.
Drought in 2018 caused peak in agricultural water usage
Water usage in agriculture is also highly dependent on weather conditions. In 2018, the national average precipitation level stood at only 675 millimetres, of which 304 millimetres fell in the months April through September. The long-term average amounts to 847 millimetres per year, of which 438 millimetres are recorded in April-September.
Due to the precipitation deficit, fields and grasslands were irrigated to a larger extent in 2018 than in previous years. The agricultural sector used a total of 302 million cubic metres of water, over 150 percent more than twelve months previously, and over 50 percent more than in 2003, which was a similarly dry year. Arable farmers used almost four times as much surface water and groundwater as in the previous year.
| Jaartal | Precipitation (mm) |
|---|---|
| 2003 | 327.55 |
| 2004 | 482.24 |
| 2005 | 446.59 |
| 2006 | 402.68 |
| 2007 | 511.71 |
| 2008 | 400.71 |
| 2009 | 335.16 |
| 2010 | 474.00 |
| 2011 | 463.94 |
| 2012 | 491.54 |
| 2013 | 370.04 |
| 2014 | 461.48 |
| 2015 | 469.09 |
| 2016 | 412.76 |
| 2017 | 453.44 |
| 2018 | 304.18 |
| Source: CBS, KNMI | |
| Jaartal | Groundwater (million m3) | Surface water (million m3) |
|---|---|---|
| 2003 | 141.71 | 57.32 |
| 2004 | 55.26 | 32.25 |
| 2005 | 54.79 | 20.03 |
| 2006 | 91.98 | 29.86 |
| 2007 | 49.28 | 22.58 |
| 2008 | 51.57 | 20.12 |
| 2009 | 73.35 | 19.53 |
| 2010 | 93.23 | 28.74 |
| 2011 | 88.58 | 30.86 |
| 2012 | 46.69 | 13.51 |
| 2013 | 83.01 | 23.85 |
| 2014 | 60.84 | 21.94 |
| 2015 | 77.01 | 28.89 |
| 2016 | 56.44 | 20.06 |
| 2017 | 96.98 | 22.73 |
| 2018 | 225.34 | 76.83 |
| Source: CBS, WEcR | ||
Livestock farming accounts for over half of water use on farms
More than half of the surface water and groundwater used in agriculture in 2018 was used by livestock farmers, mainly for irrigation (78 percent) of pasture (for cattle feeding) and a minor portion (22 percent) as livestock drinking water.
In 2018, surface water and groundwater use in livestock farming was more than double the level of 2017.
| Surface water and groundwater | |
|---|---|
| Livestock farming | 160 |
| Arable farming | 100 |
| Horticulture | 26 |
| Other agriculture | 16 |
| Source: CBS, WEcR | |
Shift from fresh to salt surface water
Since 2003, the abstraction of surface water for drinking water supply, agriculture, energy supply and manufacturing has decreased by 6.8 percent. Over 95 percent of the abstracted surface water is used as cooling water in energy production at electricity plants and large industrial enterprises. This water is immediately discharged again after the cooling process. The decline can be fully attributed to lower usage of fresh surface water (more than one-quarter). On the other hand, more and more salt water is extracted for cooling water; in 2012-2018, with usage rising by 45 percent.
| Jaartal | Fresh water (bn m3) | Salt water (bn m3) |
|---|---|---|
| 2003 | 9.48 | 4.54 |
| 2004 | 10.64 | 4.32 |
| 2005 | 10.53 | 3.47 |
| 2006 | 10.00 | 3.59 |
| 2007 | 9.96 | 3.67 |
| 2008 | 9.72 | 3.66 |
| 2009 | 10.40 | 3.88 |
| 2010 | 9.93 | 4.18 |
| 2011 | 9.20 | 6.20 |
| 2012 | 9.80 | 4.26 |
| 2013 | 9.65 | 5.10 |
| 2014 | 8.44 | 5.93 |
| 2015 | 7.42 | 7.31 |
| 2016 | 7.01 | 7.44 |
| 2017 | 6.90 | 6.64 |
| 2018 | 6.91 | 6.16 |