Over 200 times more passenger cars than in 1927
For this historical timeline, CBS conducted a long time series analysis of the Dutch motor vehicle fleet. After putting together all available data sources, additional estimates were performed to make up for the missing data. Time series breaks which developed over time due to changes in e.g. sources, definitions, composition of vehicle categories as well as reference year shifts have been mended.
Rapid fleet expansion in the 1960s
The first motor vehicle statistics were published in 1927, when 41 thousand passenger cars were recorded in the Netherlands. This number had gone up to 98 thousand by 1939. Although growth was interrupted during the Second World War, the 100 thousand threshold was already crossed in 1949. By 1965 there were 1 million cars, rising to 2 million four years later.This year, the motor vehicle fleet includes a total of 8.5 million passenger cars.
| periode | Number of passenger cars x 1,000 (x 1,000) |
|---|---|
| 1927 | 41.2 |
| 1928 | 47.7 |
| 1929 | 55.3 |
| 1930 | 63.2 |
| 1931 | 70.6 |
| 1932 | 77.3 |
| 1933 | 82.4 |
| 1934 | 86.6 |
| 1935 | 88.5 |
| 1936 | 87.6 |
| 1937 | 88.7 |
| 1938 | 90.9 |
| 1939 | 95.1 |
| 1940 | 98.2 |
| 1941 | 16.1 |
| 1942 | 15.2 |
| 1943 | 13.5 |
| 1944 | 12.2 |
| 1945 | 10.8 |
| 1946 | 37.1 |
| 1947 | 54.5 |
| 1948 | 73.8 |
| 1949 | 95.0 |
| 1950 | 120.4 |
| 1951 | 141.9 |
| 1952 | 158.3 |
| 1953 | 172.9 |
| 1954 | 194.1 |
| 1955 | 231.3 |
| 1956 | 282.2 |
| 1957 | 334.9 |
| 1958 | 379.8 |
| 1959 | 418.5 |
| 1960 | 464.0 |
| 1961 | 537.4 |
| 1962 | 634.2 |
| 1963 | 751.1 |
| 1964 | 902.6 |
| 1965 | 1093.9 |
| 1966 | 1302.0 |
| 1967 | 1513.6 |
| 1968 | 1743.0 |
| 1969 | 2010.1 |
| 1970 | 1979.4 |
| 1971 | 2347.9 |
| 1972 | 2741.7 |
| 1973 | 2946.2 |
| 1974 | 2872.2 |
| 1975 | 3092.2 |
| 1976 | 3336.4 |
| 1977 | 3518.0 |
| 1978 | 3703.0 |
| 1979 | 3906.0 |
| 1980 | 4123.0 |
| 1981 | 4263.0 |
| 1982 | 4321.0 |
| 1983 | 4385.0 |
| 1984 | 4471.0 |
| 1985 | 4551.0 |
| 1986 | 4616.0 |
| 1987 | 4676.0 |
| 1988 | 4806.0 |
| 1989 | 4967.0 |
| 1990 | 5118.0 |
| 1991 | 5205.0 |
| 1992 | 5247.0 |
| 1993 | 5341.0 |
| 1994 | 5456.0 |
| 1995 | 5581.0 |
| 1996 | 5664.0 |
| 1997 | 5810.0 |
| 1998 | 5931.0 |
| 1999 | 6120.0 |
| 2000 | 6343.2 |
| 2001 | 6539.0 |
| 2002 | 6710.6 |
| 2003 | 6854.9 |
| 2004 | 6908.9 |
| 2005 | 6992.0 |
| 2006 | 7092.3 |
| 2007 | 7230.2 |
| 2008 | 7391.9 |
| 2009 | 7542.3 |
| 2010 | 7622.4 |
| 2011 | 7735.5 |
| 2012 | 7858.7 |
| 2013 | 7915.6 |
| 2014 | 7932.3 |
| 2015 | 7979.1 |
| 2016 | 8100.9 |
| 2017 | 8223.0 |
| 2018 | 8373.2 |
| 2019 | 8530.6 |
| 2020 |
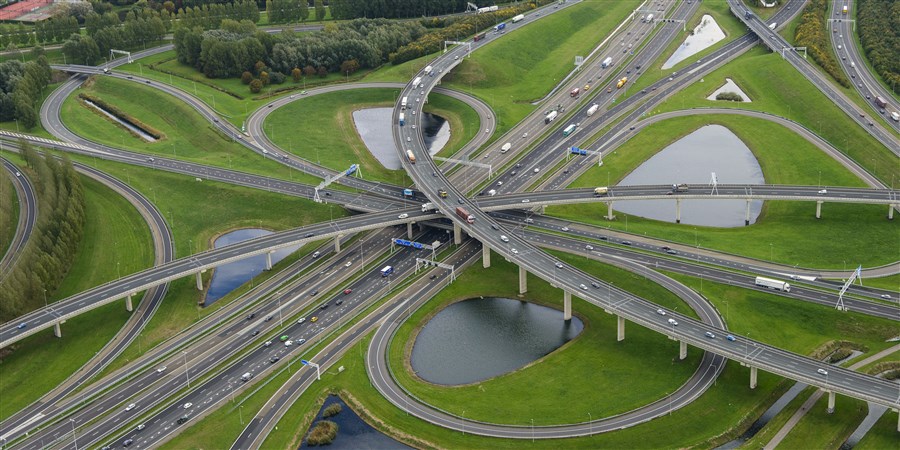
Sharp rise in commuter traffic
In the post-war period, demand was boosted by the development of commuter traffic. Commuter flows could be derived from census data. A tripling took place in the number of people going to work outside their municipality of residence: from 544 thousand (1947) to 1.1 million (1960) to 1.6 million (1971). The commuting trend arose partly as a result of housing shortages; at the same time, the geographical spread of industrial establishments and a decline in agricultural employment contributed to this rise in commuter traffic. In the late 1960s, as housing shortages were solved in the smaller municipalities while the living environment in larger municipalities deteriorated, more and more people moved away from the city.
Commuter traffic has risen sharply ever since. In 1947, 15 percent of the labour force were working outside their municipality. In 1960, this share was 27 percent and in 1971 it was 34 percent. By 2017, the share of commuters among workers had gone up to 63 percent.
Desire for freedom
The car also enabled people to satisfy their desire for freedom and provided a way to spend increased leisure time. More people took the car to make trips. The first traffic jams were created in the 1950s. Initially these were limited to leisure time: road jams on the weekends and in holiday periods (Easter and Whitsun weekends, for example), and summer holidays. The car was a desirable object, with consumers willing to change their spending pattern accordingly.
Nearly 1 car in every 2 inhabitants
The relative growth in car fleet is as impressive as its absolute growth. Adjusted for the population increase, the fleet rose from 12 passenger cars per one thousand inhabitants in 1950 to 41 per thousand inhabitants in 1960; 153 in 1970 and 300 in 1981. By 2000, vehicle density was already 400 per thousand inhabitants. At the beginning of 2019, the counter stood at 494, nearly 1 car in every 2 inhabitants.
| Jaar | Cars per 1,000 inhabitants |
|---|---|
| 1927 | 6 |
| 1928 | 6 |
| 1929 | 7 |
| 1930 | 8 |
| 1931 | 9 |
| 1932 | 10 |
| 1933 | 10 |
| 1934 | 10 |
| 1935 | 11 |
| 1936 | 10 |
| 1937 | 10 |
| 1938 | 11 |
| 1939 | 11 |
| 1940 | 11 |
| 1941 | 2 |
| 1942 | 2 |
| 1943 | 2 |
| 1944 | 1 |
| 1945 | 1 |
| 1946 | 4 |
| 1947 | 6 |
| 1948 | 8 |
| 1949 | 10 |
| 1950 | 12 |
| 1951 | 14 |
| 1952 | 15 |
| 1953 | 17 |
| 1954 | 18 |
| 1955 | 22 |
| 1956 | 26 |
| 1957 | 31 |
| 1958 | 34 |
| 1959 | 37 |
| 1960 | 41 |
| 1961 | 47 |
| 1962 | 54 |
| 1963 | 63 |
| 1964 | 75 |
| 1965 | 90 |
| 1966 | 105 |
| 1967 | 121 |
| 1968 | 138 |
| 1969 | 157 |
| 1970 | 153 |
| 1971 | 179 |
| 1972 | 207 |
| 1973 | 220 |
| 1974 | 213 |
| 1975 | 227 |
| 1976 | 243 |
| 1977 | 255 |
| 1978 | 266 |
| 1979 | 279 |
| 1980 | 293 |
| 1981 | 300 |
| 1982 | 303 |
| 1983 | 306 |
| 1984 | 311 |
| 1985 | 315 |
| 1986 | 318 |
| 1987 | 320 |
| 1988 | 327 |
| 1989 | 336 |
| 1990 | 344 |
| 1991 | 347 |
| 1992 | 347 |
| 1993 | 351 |
| 1994 | 356 |
| 1995 | 362 |
| 1996 | 366 |
| 1997 | 373 |
| 1998 | 379 |
| 1999 | 388 |
| 2000 | 400 |
| 2001 | 409 |
| 2002 | 417 |
| 2003 | 423 |
| 2004 | 425 |
| 2005 | 429 |
| 2006 | 434 |
| 2007 | 442 |
| 2008 | 451 |
| 2009 | 458 |
| 2010 | 460 |
| 2011 | 464 |
| 2012 | 470 |
| 2013 | 472 |
| 2014 | 471 |
| 2015 | 472 |
| 2016 | 477 |
| 2017 | 481 |
| 2018 | 487 |
| 2019 | 494 |
| 2020 |