Energy consumption down in 2018
| Year | Natural gas (PJ) | Crude oil materials and products (PJ) | Coal and coal products (PJ) | Other energy carriers (PJ) |
|---|---|---|---|---|
| 1990 | 1325 | 1048.4 | 366.9 | 115.7 |
| 1991 | 1478.5 | 1034.3 | 335.6 | 113.1 |
| 1992 | 1439.7 | 1046.6 | 335.3 | 121.6 |
| 1993 | 1480.7 | 1060.1 | 336.6 | 131.4 |
| 1994 | 1430 | 1082.5 | 367.2 | 134.7 |
| 1995 | 1468.9 | 1109 | 373.6 | 142.6 |
| 1996 | 1627.9 | 1134.5 | 361.1 | 152.3 |
| 1997 | 1525.3 | 1136.2 | 351.7 | 148.8 |
| 1998 | 1506.2 | 1144.8 | 357.9 | 162.4 |
| 1999 | 1471.6 | 1149.8 | 312.3 | 189.8 |
| 2000 | 1475.7 | 1150.7 | 325.2 | 193.9 |
| 2001 | 1505.5 | 1176.9 | 346.2 | 191.5 |
| 2002 | 1490.3 | 1208.9 | 348 | 195.9 |
| 2003 | 1500.6 | 1295.1 | 359.3 | 200.6 |
| 2004 | 1536.4 | 1296.6 | 354.6 | 206.9 |
| 2005 | 1492.4 | 1292.6 | 338.6 | 242.6 |
| 2006 | 1433.1 | 1302.9 | 323.9 | 249.6 |
| 2007 | 1397 | 1311.3 | 351.8 | 246.6 |
| 2008 | 1454 | 1227.2 | 333.5 | 262.2 |
| 2009 | 1488.9 | 1202.9 | 312.4 | 239.2 |
| 2010 | 1683.3 | 1251.8 | 315.5 | 224.1 |
| 2011 | 1473.4 | 1201 | 311.4 | 253.4 |
| 2012 | 1414.2 | 1212.1 | 341.2 | 283.4 |
| 2013 | 1408 | 1149.6 | 342.8 | 283.3 |
| 2014 | 1241 | 1138.9 | 378.8 | 281 |
| 2015 | 1226.9 | 1143.7 | 461.1 | 276.1 |
| 2016 | 1265.5 | 1181.9 | 427.3 | 269.6 |
| 2017** | 1299.3 | 1195.9 | 383 | 272.3 |
| 2018* | 1285 | 1171.4 | 342.7 | 299.4 |
| *Provisional figures **Revised provisional figures | ||||
Total energy consumption in the Netherlands over 2018 was approximately 1.5 percent down on 2017. In recent years, natural gas has taken up more than 40 percent of domestic energy consumption while petroleum has accounted for slightly less than 40 percent. Coal’s contribution declined to 11 percent in 2018. Together, these three fossil sources accounted for 90 percent of total energy consumption last year, i.e. 2 percent less than in 2017.
Other energy sources include renewable energy, nuclear energy, waste and overall net electricity imports.
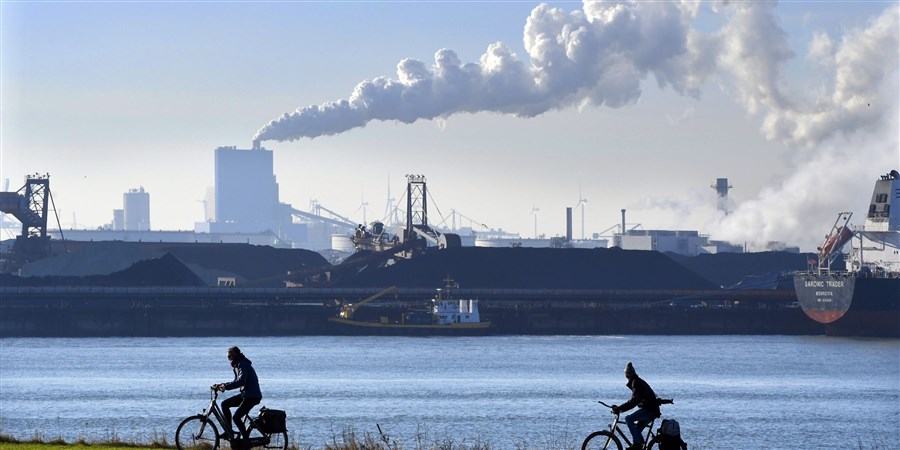
Coal consumption back at previous level
For the third consecutive year, less coal was used in electricity production. Total coal consumption declined from 380 PJ in 2017 to 340 PJ in 2018. These reductions partly result from the closure of old coal-fired plants as part of the 2013 Energy Agreement. Coal consumption rose sharply between 2013 and 2016 due to the commissioning of new plants.
In 2018, coal consumption was roughly equal to the average level over the period 2000 to 2013, before commissioning of the new coal plants.
| Year | Consumption (PJ) | Production (PJ) | Imports (PJ) |
|---|---|---|---|
| 2000 | 387.5 | 322.7 | 68.1 |
| 2001 | 396 | 337.2 | 62.2 |
| 2002 | 401.5 | 345.5 | 59 |
| 2003 | 407.5 | 348.5 | 61.2 |
| 2004 | 417.7 | 364.4 | 58.4 |
| 2005 | 426.5 | 359.7 | 65.9 |
| 2006 | 430.3 | 355.8 | 77.3 |
| 2007 | 439.3 | 378.6 | 63.4 |
| 2008 | 442.1 | 387.2 | 57.1 |
| 2009 | 428.4 | 409.3 | 17.6 |
| 2010 | 440.5 | 429.4 | 10 |
| 2011 | 441.9 | 410.3 | 32.7 |
| 2012 | 425.3 | 371.6 | 61.6 |
| 2013 | 430.1 | 365.9 | 65.7 |
| 2014 | 421.4 | 372.1 | 53 |
| 2015 | 432.8 | 397.4 | 31.5 |
| 2016 | 437 | 414.8 | 17.7 |
| 2017** | 434.4 | 422.1 | 12.6 |
| 2018* | 435.2 | 406.5 | 28.7 |
| *Provisional figures | |||
Electricity imports offset phasing out of coal
In 2016 and 2017, falling production of electricity from coal was accompanied by higher domestic electricity production from other sources, mainly natural gas. In 2018, however, the reduced production was offset by higher imports of electricity. Net imports rose from 3 percent of electricity consumption to 7 percent, a total of 29 PJ. Last year, overall electricity consumption in the Netherlands stood at 435 PJ.
Production, import and export levels of electricity are determined by technical, weather and market conditions at home and abroad. Production and net import of electricity have therefore shown much less consistency over the past decade than consumption levels.
| Year | Exports (petajoules) | Imports (petajoules) | Extraction (petajoules) |
|---|---|---|---|
| 1990 | 1081.4 | 85.1 | 2283 |
| 1991 | 1215.6 | 73.3 | 2581.2 |
| 1992 | 1287 | 88.6 | 2592.2 |
| 1993 | 1317.7 | 110.5 | 2642.4 |
| 1994 | 1219.9 | 110.2 | 2506.6 |
| 1995 | 1219.6 | 115.6 | 2548.2 |
| 1996 | 1464 | 170.8 | 2883.9 |
| 1997 | 1273.5 | 216.6 | 2554.2 |
| 1998 | 1166 | 216.2 | 2436.4 |
| 1999 | 1142.6 | 324.5 | 2265.6 |
| 2000 | 1241.9 | 522.3 | 2209 |
| 2001 | 1486 | 641.5 | 2327.3 |
| 2002 | 1575.1 | 802.7 | 2286.7 |
| 2003 | 1442.6 | 764.3 | 2185.8 |
| 2004 | 1606 | 565.3 | 2578.2 |
| 2005 | 1564.9 | 688.2 | 2352 |
| 2006 | 1639.9 | 755.3 | 2322.1 |
| 2007 | 1670.2 | 782.9 | 2232.1 |
| 2008 | 1851.7 | 793.8 | 2552.7 |
| 2009 | 1668.5 | 770.1 | 2358 |
| 2010 | 1786.1 | 772.5 | 2709.6 |
| 2011 | 1719.3 | 719.5 | 2501.9 |
| 2012 | 1906.5 | 841.4 | 2462.5 |
| 2013 | 2128.1 | 913.1 | 2606.6 |
| 2014 | 1846.7 | 934.7 | 2173.9 |
| 2015 | 1663.3 | 1223.9 | 1651.4 |
| 2016 | 1796.5 | 1384.1 | 1594.3 |
| 2017** | 1681.5 | 1624.4 | 1388.5 |
| 2018* | 1576.9 | 1769.2 | 1161.7 |
| *Provisional figures | |||
Natural gas: imports exceeding exports
In 2018, natural gas extraction declined by over 200 PJ to 1,600 PJ, a reduction of 16 percent. It was the fifth consecutive year of decline. The decline is related to output restrictions following the occurrence of earthquakes in the province of Groningen. Total output in the Netherlands now stands at less than half of the output before 2014.
Reduced extraction levels are primarily offset by imports of natural gas. As of 2012, these imports have increased on a yearly basis; in 2018, more natural gas was imported (1,770 petajoules) than was extracted domestically (1,580 PJ) for the first time. Exports as well have followed a downward trend as of 2013.