Over 600 billion kg of inbound goods in 2017
Around half of this inbound cargo was destined for either transit or re-export. Goods in transit remain in foreign ownership but are transhipped or stored (temporarily) within the Netherlands. In the case of re-export, the goods are temporarily under Dutch ownership and often undergo minor processing before being re-exported. Re-exports are included in inbound and outbound transport, while transit goods are not.
In addition to re-exports and goods in transit, 226 billion kg of domestically produced goods crossed the border. Altogether 545 billion kg of goods left the country, virtually similar to 2016.
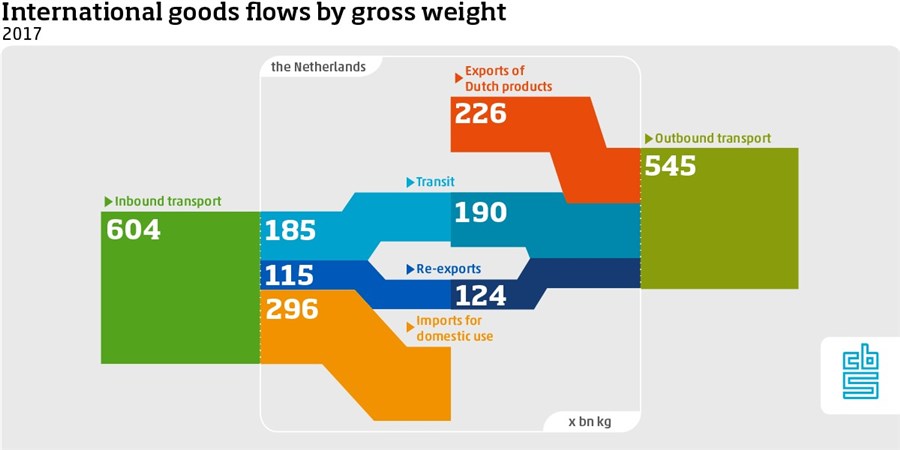
The sum of imports for domestic use, re-exports and transit deviates slightly from the volume of inbound transport. A small difference is also seen on the side of outbound transport. This is due to the fact that the chart displays combined flows of inbound and outbound cargo that include goods not destined for trade.
More inbound chemical products
In 2017, altogether 66 billion kilos of chemical goods arrived in the Netherlands, i.e. over 11 percent up on 2016. The volume of inbound agricultural and food products, live animals and foragewas over 9 percent higher. Inward transport of vehicles, machinery and general cargo increased by 7 percent. Furthermore, there were rising shares of ores, metals and crude minerals. By contrast, in 2017 there was a lower supply of fossil fuels, which have always constituted the largest proportion of inbound goods by far in terms of weight.
| 2017 (bn kg) | 2016 (bn kg) | |
|---|---|---|
| Fossil fuels | 267.2 | 274.5 |
| Agricultural products, food products, live animals and forage | 95.6 | 87.6 |
| Chemical products and fertilisers | 71.9 | 65.3 |
| Ores and metals | 64.1 | 61.7 |
| Vehicles, machinery and general cargo | 53.6 | 50 |
| Crude minerals | 51.9 | 51.1 |
Inbound freight increased in weight by 3 percent between 2007-2017
Measured by weight, inbound cargo arriving in the Netherlands grew by 3 percent between 2007 and 2017. The relatively modest increase in this period was partly due to the economic crisis. In 2009, inward transport plummeted by 12 percent in the span of twelve months. Relative to 2007, there were lower volumes of inbound crude minerals, ores and metals in 2017. Outbound transport of goods from the Netherlands rose by 11 percent in weight between 2007 and 2017.
An article (in Dutch only) on international goods flows contains a comprehensive analysis of goods flows into, through and out of the Netherlands over the period 2007-2017. The origins and destinations of these goods flows as well as modes of transportation are included. The article also focuses on changes in the value of these goods flows.
| Year | Gross weight inbound transport (bn kg) | Gross weight outbound transport (bn kg) |
|---|---|---|
| 2007 | 586.6 | 492 |
| 2008 | 594.7 | 496.5 |
| 2009 | 524.5 | 454.6 |
| 2010 | 570.5 | 496.6 |
| 2011 | 573.2 | 505.1 |
| 2012 | 567.7 | 503.3 |
| 2013 | 564.9 | 532.5 |
| 2014 | 577.2 | 541.4 |
| 2015 | 591.2 | 542.4 |
| 2016 | 590.1 | 545.1 |
| 2017 | 604.4 | 544.5 |