More fresh sea fish landed in Dutch ports
Between 2005 and 2015, the total quantity of landed fish was in continuous decline. In 2015, this trend was broken and fishing yields doubled relative to one year previously. This level was no longer reached after 2015 although yields remained higher than in 2014. The quantity of landed fish is largely determined by fishing quotas (catch limits) which are set per fish species under the EU’s Common Fisheries Policy (CFP).
| By trawlers (million kg) | By cutters (million kg) | |
|---|---|---|
| 2002 | 398.3 | 120.2 |
| 2003 | 468.5 | 119.2 |
| 2004 | 493.8 | 114.1 |
| 2005 | 546.1 | 108.7 |
| 2006 | 504.9 | 100.4 |
| 2007 | 453.9 | 105.7 |
| 2008 | 371.2 | 100.1 |
| 2009 | 336 | 138.6 |
| 2010 | 337.1 | 87.9 |
| 2011 | 283.4 | 81.9 |
| 2012 | 284 | 69.5 |
| 2013 | 223.8 | 68.2 |
| 2014 | 205.8 | 63.3 |
| 2015 | 462.6 | 93.5 |
| 2016 | 321.4 | 75.3 |
| 2017* | 423.6 | 67 |
| *Provisional figures 1Excluding species that are landed in small quantities. | ||
Fish landings are mainly carried out by trawlers that deepfreeze the fish and bring it ashore. Trawlers account for approximately 80 percent of fish landed in the Netherlands. After 2014, catches of herring, mackerel, blue whiting and sardines have reached higher levels in particular. Trawlers concentrate on schools of fish swimming in deeper waters.
| Herring (million kg) | Blue whiting (million kg) | Mackerel (million kg) | Horse mackerel (million kg) | Sardines (million kg) | |
|---|---|---|---|---|---|
| 2002 | 151.6 | 51.5 | 85.4 | 92.1 | 17.7 |
| 2003 | 179.7 | 78.1 | 80.5 | 108.3 | 21.9 |
| 2004 | 195.5 | 108.7 | 69.8 | 105.6 | 14.3 |
| 2005 | 228 | 156 | 49.9 | 104.2 | 8.1 |
| 2006 | 174.9 | 154.5 | 49.4 | 105.9 | 20.2 |
| 2007 | 159.6 | 138.1 | 54 | 90.8 | 11.5 |
| 2008 | 102.7 | 114.3 | 49.5 | 94 | 10.8 |
| 2009 | 107.3 | 48.1 | 67.2 | 95 | 18.5 |
| 2010 | 89.5 | 48.1 | 67.3 | 123 | 9.2 |
| 2011 | 86.2 | 4.8 | 68 | 114.2 | 10.2 |
| 2012 | 99.1 | 33.7 | 38.4 | 99.5 | 13.2 |
| 2013 | 90 | 47.1 | 20.7 | 62 | 3.9 |
| 2014 | 85.3 | 38.6 | 46.1 | 32.7 | 3.2 |
| 2015 | 172.6 | 101.9 | 113.5 | 57.1 | 17.6 |
| 2016 | 127.2 | 65 | 58.7 | 33.6 | 36.9 |
| 2017* | 152 | 122.8 | 76.1 | 42.4 | 30.3 |
| *Provisional figures | |||||
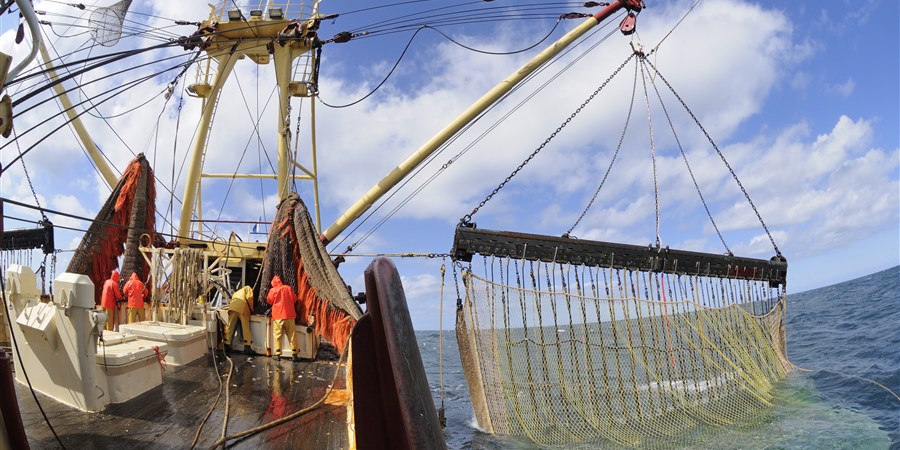
Commercial fishing is not only carried out by trawlers but also by cutters, which focus on bottom fishing in coastal waters. Until recently, this was mainly done by so-called beam trawls. In the past few years, however, other techniques have been used by cutters as well, such as pulse fishing.
In 2015, not only trawlers but also cutters brought much higher quantities of fish ashore than in previous years. In 2016 and 2017, their catches dropped again. The peak in quantities of landed fish and the decline that followed is closely related to the variation in plaice catches. These are caught in the largest quantities by far.
| Plaice (million kg) | Common shrimps (million kg) | Sole (million kg) | Cod (million kg) | |
|---|---|---|---|---|
| 2002 | 59.9 | 7.4 | 22.2 | 7.6 |
| 2003 | 58.7 | 10.3 | 24.1 | 4.4 |
| 2004 | 55 | 9.6 | 24.9 | 3.4 |
| 2005 | 51.8 | 9.7 | 21.9 | 2.8 |
| 2006 | 49.1 | 9.8 | 16.2 | 2.7 |
| 2007 | 47.5 | 8.7 | 19.9 | 3 |
| 2008 | 46 | 10.9 | 18.2 | 3.2 |
| 2009 | 48.4 | 15.1 | 18.1 | 4.5 |
| 2010 | 45.1 | 14 | 10.2 | 3.4 |
| 2011 | 43.9 | 13.3 | 8.8 | 2 |
| 2012 | 35.6 | 11.9 | 9.4 | 1.5 |
| 2013 | 32.9 | 15.5 | 9.9 | 0.7 |
| 2014 | 25.7 | 19.1 | 8.7 | 0.6 |
| 2015 | 49.7 | 16.7 | 10.3 | 1.5 |
| 2016 | 35.3 | 16.2 | 9.6 | 1.3 |
| 2017* | 32.2 | 11.9 | 9.2 | 0.6 |
| *Provisional figures | ||||
In the months January through September 2018, the amount of landed fish was up by just under 2 percent on the previous year. Given the fluctuations, it can be said that the quantities in 2017 and 2018 were similar. Among some fish species, the amount landed varied significantly. This year, catches of sardines, regular mackerel and horse mackerel have dropped in particular, whereas those of shrimps have doubled. Dutch fishermen have also landed more blue whiting.
| Change (year-on-year % change) | |
|---|---|
| Common shrimps | 99.9 |
| Blue whiting | 25.8 |
| Dab | 15.7 |
| Herring | 11.5 |
| Sole | -12.1 |
| Plaice | -19.8 |
| Horse mackerel | -30.6 |
| Sardines | -35.3 |
| Mackerel | -37.3 |
| 1Ten most caught fish species by weight; provisional figures. | |
Related items
- European Commission - The Common Fisheries Policy (CFP)