More people in employment

The remainder of the group of people not in employment (over 3.8 million) had not looked or/nor been immediately available for work recently. Their number dropped by an average 11 thousand per month over the previous three months. At the end of May, the Employee Insurance Agency (UWV) recorded 301 thousand unemployment (WW) benefits.
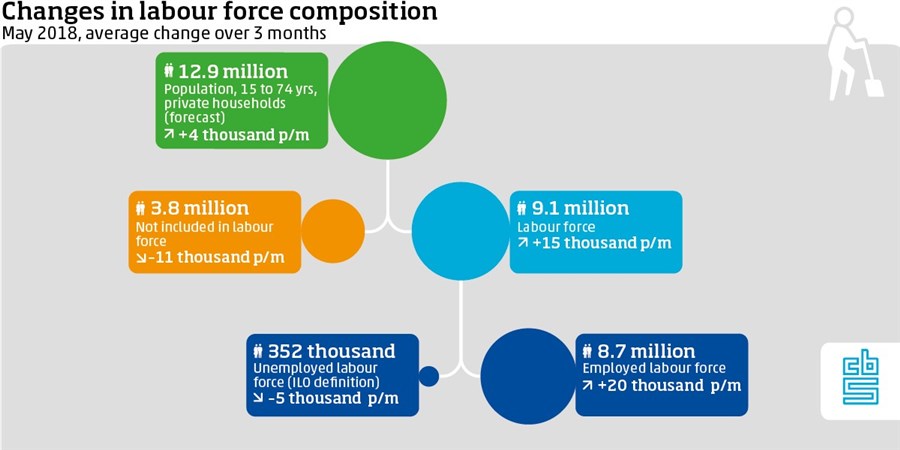
352 thousand unemployed according to ILO definition
In order to enable comparison of cyclical developments in the labour market between countries, the unemployment indicator of the ILO is often taken as a measure. According to this indicator, the ‘unemployed’ includes all 15 to 74-year-olds who do not have paid work but who have been looking for paid work recently and who are immediately available. There were 352 thousand unemployed in May, equivalent to 3.9 percent of the labour force. This is the same percentage as in the two previous months. This means that unemployment is still higher than its lowest point before the start of the economic crisis in the second half of 2008, when the unemployment rate was 3.6 percent.
| Unemployment indicator (ILO) (15-74 yrs, seasonally adjusted) (x 1,000) | Unemployment benefits (15 yrs to pension entitlement age) (x 1,000) | ||
|---|---|---|---|
| 2011 | J | 430 | 284 |
| 2011 | F | 425 | 280 |
| 2011 | M | 413 | 270 |
| 2011 | A | 411 | 261 |
| 2011 | M | 414 | 256 |
| 2011 | J | 409 | 252 |
| 2011 | J | 425 | 254 |
| 2011 | A | 427 | 256 |
| 2011 | S | 442 | 252 |
| 2011 | O | 458 | 253 |
| 2011 | N | 474 | 258 |
| 2011 | D | 473 | 270 |
| 2012 | J | 486 | 292 |
| 2012 | F | 482 | 299 |
| 2012 | M | 487 | 296 |
| 2012 | A | 502 | 292 |
| 2012 | M | 501 | 291 |
| 2012 | J | 502 | 291 |
| 2012 | J | 518 | 298 |
| 2012 | A | 517 | 304 |
| 2012 | S | 530 | 304 |
| 2012 | O | 539 | 310 |
| 2012 | N | 554 | 322 |
| 2012 | D | 572 | 340 |
| 2013 | J | 589 | 369 |
| 2013 | F | 601 | 377 |
| 2013 | M | 619 | 380 |
| 2013 | A | 625 | 380 |
| 2013 | M | 632 | 378 |
| 2013 | J | 648 | 382 |
| 2013 | J | 666 | 395 |
| 2013 | A | 670 | 399 |
| 2013 | S | 675 | 400 |
| 2013 | O | 680 | 408 |
| 2013 | N | 677 | 419 |
| 2013 | D | 687 | 438 |
| 2014 | J | 691 | 460 |
| 2014 | F | 699 | 460 |
| 2014 | M | 692 | 454 |
| 2014 | A | 684 | 443 |
| 2014 | M | 672 | 436 |
| 2014 | J | 656 | 431 |
| 2014 | J | 648 | 437 |
| 2014 | A | 637 | 430 |
| 2014 | S | 630 | 420 |
| 2014 | O | 632 | 419 |
| 2014 | N | 635 | 425 |
| 2014 | D | 643 | 441 |
| 2015 | J | 645 | 458 |
| 2015 | F | 633 | 455 |
| 2015 | M | 626 | 443 |
| 2015 | A | 625 | 427 |
| 2015 | M | 617 | 416 |
| 2015 | J | 611 | 410 |
| 2015 | J | 603 | 420 |
| 2015 | A | 604 | 420 |
| 2015 | S | 609 | 417 |
| 2015 | O | 616 | 421 |
| 2015 | N | 596 | 427 |
| 2015 | D | 588 | 446 |
| 2016 | J | 574 | 465 |
| 2016 | F | 581 | 469 |
| 2016 | M | 574 | 470 |
| 2016 | A | 572 | 461 |
| 2016 | M | 560 | 448 |
| 2016 | J | 550 | 438 |
| 2016 | J | 541 | 432 |
| 2016 | A | 521 | 427 |
| 2016 | S | 510 | 424 |
| 2016 | O | 502 | 420 |
| 2016 | N | 499 | 410 |
| 2016 | D | 482 | 412 |
| 2017 | J | 480 | 419 |
| 2017 | F | 473 | 416 |
| 2017 | M | 463 | 415 |
| 2017 | A | 456 | 401 |
| 2017 | M | 456 | 386 |
| 2017 | J | 446 | 372 |
| 2017 | J | 436 | 364 |
| 2017 | A | 426 | 362 |
| 2017 | S | 422 | 351 |
| 2017 | O | 404 | 343 |
| 2017 | N | 397 | 337 |
| 2017 | D | 395 | 330 |
| 2018 | J | 380 | 335 |
| 2018 | F | 367 | 330 |
| 2018 | M | 357 | 327 |
| 2018 | A | 355 | 314 |
| 2018 | M | 352 | 301 |
UWV: Decline in WW benefits continuing unabated
At the end of May, the UWV provided 301 thousand unemployment (WW) benefits. Because it is possible for one person to receive more than one WW benefit, this number represents 290 thousand persons. One-third (96 thousand persons) had been recipients for longer than one year. Relative to the previous month, the number of WW benefits fell by over 13 thousand (-4.2 percent). When compared to May 2017, a decline was recorded of nearly 85 thousand (-22.0 percent). The year-on-year decrease was strongest in technical occupations and in transport and logistics (both approximately -30 percent).
UWV: Lower influx in all occupational classes
In the first five months of 2018, UWV provided 149 thousand new unemployment benefits, a decrease of 14.7 percent compared to the same period last year. The influx declined in all occupational classes relative to the first five months of last year. From January up to and including May 2018, 178 thousand WW benefits were terminated, a decrease of 11.4 percent compared to the same period in 2017.
Unused labour potential
Every month, CBS publishes figures on the size of the employed labour force and the non-employed population. The latter group comprises the unemployed labour force as well as people not included in the labour force (all these groups follow the ILO definition). However, the unemployed labour force does not represent all unused labour potential. According to the ILO indicator, this includes other groups of people aside from the unemployed. These people have either looked for work recently or are immediately available for work. They are counted towards unused labour potential but fall outside the scope of the ILO definition of employment. People who work part-time but want to work more hours and are immediately available are also included in the unused labour potential.
These groups are only reported on every quarter in terms of size and composition. The overall picture provided in the table below is based on the latest quarterly figures (Q1 2018). The total unused labour potential in Q1 2018 comprised more than 1.2 million people. This was over 1.4 million one year previously. Development of the total unused labour potential closely follows developments in unemployment according to the ILO definition.
Every month, CBS publishes figures on the labour force in accordance with international guidelines. The corresponding indicators, i.e. the employed and unemployed labour force, are used around the world to describe cyclical developments on the labour market. Monthly figures are essential in this respect. In addition, UWV issues its own monthly figures on unemployment benefits. Figures released by UWV do not correspond one-to-one with the labour force indicators.
Sources
Related items
- Video - Unemployment
- Dossier - Business cycle