Number of endangered fauna and flora species not rising
The Red List is the most comprehensive, most used source of information on the status of fauna and flora species worldwide. The number of species included in a national Red List is an indication for the state of biodiversity in the Netherlands. The higher the number of endangered species, the greater the extent of nature’s deterioration.
Red List Indicator
In the Green Growth visualisation, the Red List Indicator shows a sharp decline in non-endangered flora and fauna species starting from 1950 (100 percent) to around 60 percent in 2016. In this indicator, groups of species include mammals, breeding birds, reptiles, amphibians, butterflies, dragonflies and higher plants. By definition, these are assumed to have been non-endangered up to 1950. This means around 40 percent of the recently assessed fauna and flora species are now being threatened with extinction or are vulnerable to it.
Over one-third of all species were already included in the Red List before 1995 due to being endangered to a greater or lesser extent. Between 1995 and 2005, the total number of threatened species saw a modest further increase, but it has dropped slightly as of 2005.
The Red List Indicator shows average values. Even after 2005, the threat to certain species has grown more severe. This includes breeding birds on farmland. On the other hand, more species have seen progress; these include certain plants as well as dragonflies and mammals.
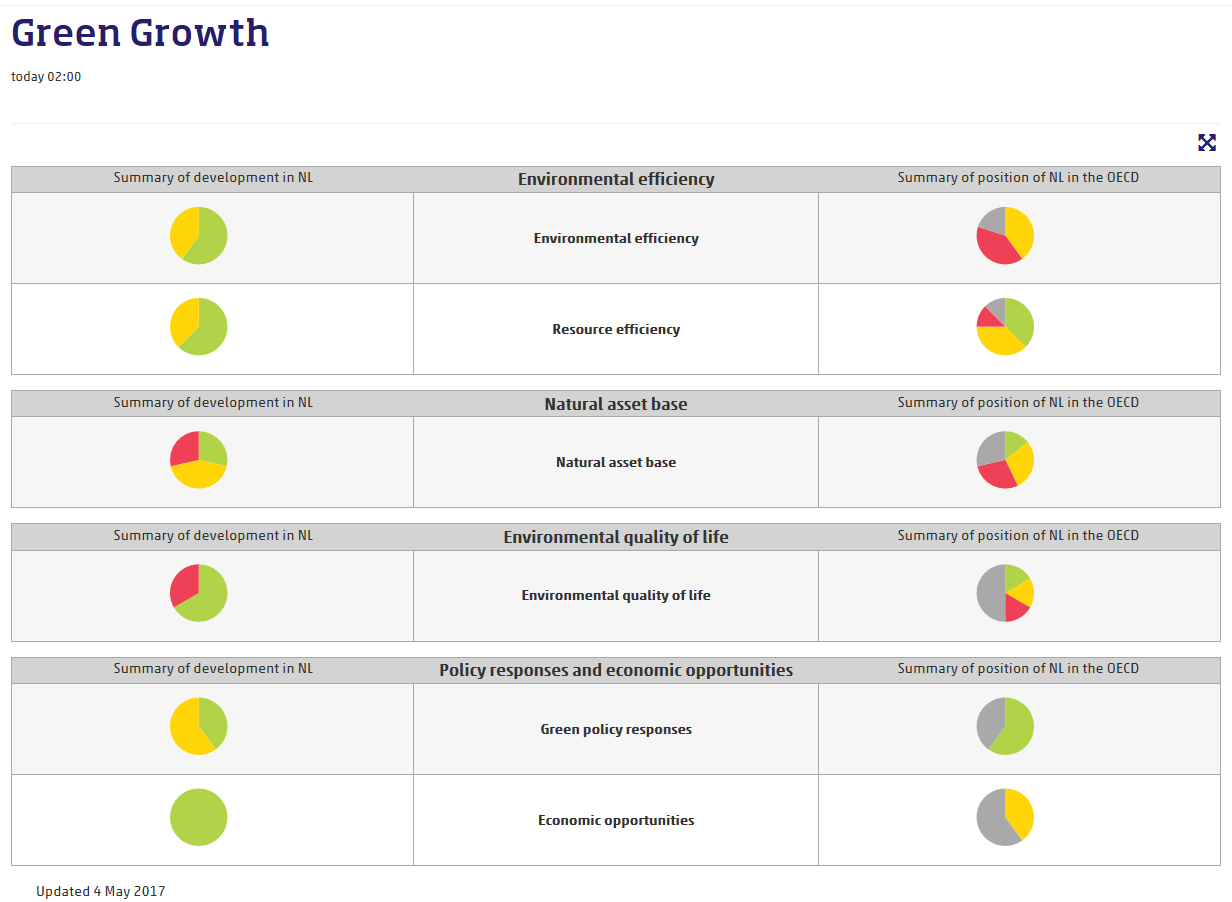
Visualisation: Green growth
The Green Growth visualisation highlights the performance of various indicators in the areas of eco-efficiency, natural resources, environmental quality of life, policy instruments and economic opportunities. The visualisation shows trends in the Netherlands on each individual indicator as well as the Netherlands’ ranking within the European Union or the OECD. The Red List Indicator is one of these indicators.Sources
- Visualisation - Green Growth
Related items
- News release - Share of renewable energy at 5.9% in 2016