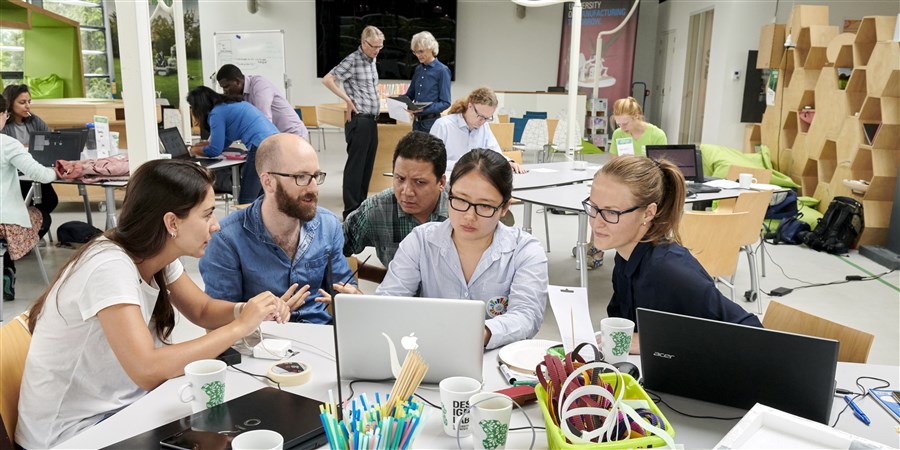
The venue of the data camp – which took place from 28 May to 1 June - was UT’s DesignLab. It was the third data camp organised jointly by UT and the CBS, but it was the first time that DesignLab was approached to co-organise and host the event. The pioneering character of this innovation platform within UT turned out to be a hothouse for novel data insights. In previous data camps, researchers from the CBS and universities tackled research questions with the aid of big data. ‘This time we used a different approach,’ explained Jacobiene van der Hoeven of the CBS’ expertise centre on collaboration with universities (ECHO). ‘The focus was on data visualisation and the United Nations’ SDGs. The challenges and data came not only from the CBS and UT, but also for example from Overijssel province, Curacao’s central bureau of statistics and a research institute from Costa Rica. The innovative initiatives of UT, such as DesignLab, is one of the reasons we value our strategic partnership with this university so highly.’
The United Nations adopted the seventeen SDGs in 2015 and they have to be achieved by 2030. The CBS monitors Dutch progress on the goals using a wide range of indicators. The second CBS report on the SDGs in the Netherlands was published in March this year and received extensive attention from other government organisations and the media. Van der Hoeven: ‘The theme is very important for the Netherlands. During the data camp multidisciplinary teams of researchers, PhD students, professionals and experts combined their knowledge and skills to approach the data from different perspectives. They showed us how visualisations can make complex sustainability phenomena easier to understand.’ One of the challenges came from the CBS: it asked participants to map differences in well-being in Europe. It also sent along experts in the area of methodology and geographic information systems (GIS) to support the participants. ‘It is great to see what a small group of passionate people with a wide range of skills and cultural knowledge can achieve in such inspiring surroundings. We discovered new possibilities for visualisation methods and cross-links which we shall investigate further for new joint projects. And we were able to expand our network.’
Collaboration and creativity
The UN SDGs are also important for the UT. Frank Kresin, DesignLab’s director: ‘They are an important framework for sustainable development to which we are fully committed. DesignLab has relations with many very intelligent students and researchers. Together we have a lot to contribute.’ DesignLab is a platform at UT for multidisciplinary collaboration and creativity focusing on design education and research in the area of design. ‘It is the perfect venue for a data camp’, says Kresin. ‘Two thousand square metres in which students and scientists – assisted by our Dream Team and the DesignLab Research Fellows - work together with businesses and social organisations. In this way we can connect scientific knowledge with community issues and challenges. This results in innovative solutions and products which are always based on concrete needs of partners from society.’ Looking back at the previous five days, Kresin too is extremely pleased with the results. ‘It has been a very valuable week for the participants; they have gained practical experience, learnt new methods and approaches and got lots of new ideas. The results show that new sustainable solutions are possible! In addition, the data camp has further reinforced our partnership with the CBS and other experts.’
Data visualisation delivers new insights
Curacao’s central bureau of statistics was another enthusiastic participant in the SDG DataViz Camp. Leander Kuijvenhoven: ‘The theme of this data camp immediately appealed to us. The SDGs are important for our work and visualising the data was an innovative way to address them. The data from our 2015 social cohesion survey were a good starting point to examine inequality against the background of the SDGs. The participants’ fresh approach to the data resulted in new insights, and resulted in a number of concrete ideas for an interactive tool to explore the SDGs from a visual perspective.’