6 in 10 young people have confidence in politics, interest has increased
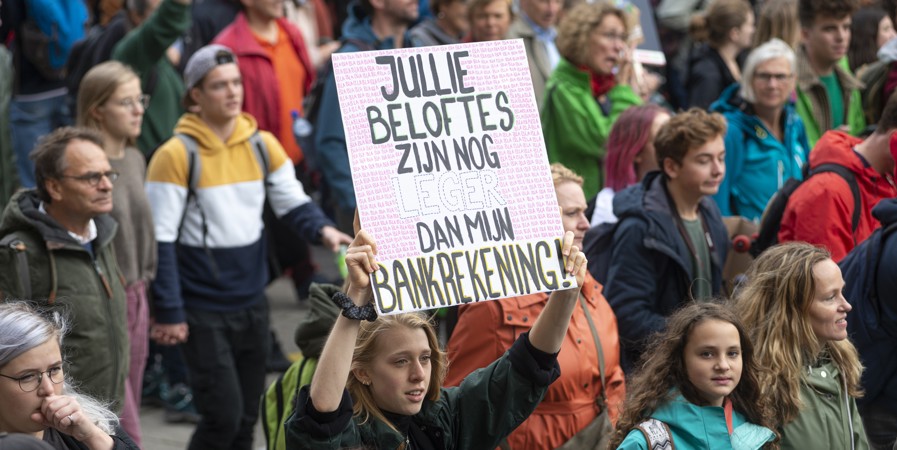
Political engagement among younger people has seen an increase over the past few years. They have more confidence in politics than older age groups and are also more likely to take part in protests and demonstrations. However, they are also less interested in politics than older age groups, although interest in politics among this age group has increased in recent years. This is reported by Statistics Netherlands (CBS) on the basis of new figures for 2025 from the Social Cohesion and Well-being survey.
Young adults are the only age group in which trust in politics has risen
Older people have less trust in politics than younger people. In 2025, 62 percent of people aged 15-17 years and 55 percent of those aged 18-24 years said they had confidence in politics. Among those aged 65-74, the percentage was half of that, at 31 percent. Between 2023 and 2025, young people aged 18-24 were the only age group in which confidence in politics had increased.
| Jaar | 15-17 yrs (%) | 18-24 yrs (%) | 25-34 yrs (%) | 35-44 yrs (%) | 45-54 yrs (%) | 55-64 yrs (%) | 65-74 yrs (%) | 75 yrs and older (%) |
|---|---|---|---|---|---|---|---|---|
| 2016 | 64.7 | 50.5 | 43.7 | 40.3 | 35.1 | 32.2 | 32.2 | 35.9 |
| 2017 | 70.1 | 59.9 | 49.1 | 45.6 | 40.1 | 36.7 | 33.2 | 40.3 |
| 2018 | 76.1 | 60.0 | 52.2 | 45.8 | 43.3 | 35.5 | 34.8 | 40.9 |
| 2019 | 65.3 | 62.2 | 51.6 | 46.8 | 40.4 | 35.3 | 34.5 | 37.9 |
| 2020 | 77.5 | 71.4 | 60.2 | 55.8 | 51.1 | 45.2 | 39.5 | 45.5 |
| 2021 | 72.5 | 63.7 | 56.0 | 50.0 | 48.5 | 38.5 | 35.9 | 38.4 |
| 2022 | 66.5 | 55.5 | 41.1 | 42.9 | 37.9 | 31.5 | 31.6 | 35.6 |
| 2023 | 63.3 | 48.9 | 43.6 | 42.7 | 38.2 | 32.4 | 31.3 | 29.4 |
| 2024 | 59.6 | 51.3 | 50.6 | 42.9 | 42.7 | 36.5 | 32.9 | 35.6 |
| 2025 | 62.1 | 55.1 | 42.4 | 38.5 | 37.4 | 35.1 | 31.4 | 34.3 |
People aged 18-34 are the most likely to take part in protests or demonstrations
Young people aged 18-34 – particularly students and those who have completed higher education – are more likely to take part in protests or demonstrations than those aged 35 years and over. Participation in protests and demonstrations by young people rose after 2018, but fell back somewhat in 2023 and 2024. Among those aged 35 and over, participation in protests and demonstrations fluctuated somewhat prior to 2025. In 2025, participation increased across all age groups.
| Jaar | 18-24 yrs (%) | 25-34 yrs (%) | 35-44 yrs (%) | 45-54 yrs (%) | 55-64 yrs (%) | 64-74 yrs (%) | 75 yrs and older (%) |
|---|---|---|---|---|---|---|---|
| 2016 | 7.3 | 4.7 | 3.9 | 3.3 | 4.1 | 1.6 | 2.4 |
| 2017 | 4.2 | 6.1 | 3.6 | 3.8 | 5.4 | 3.1 | 1.3 |
| 2018 | 3.3 | 5.5 | 4.2 | 3.9 | 5.2 | 3.2 | 1.2 |
| 2019 | 6.5 | 6.2 | 5.5 | 4.6 | 6.1 | 3.8 | 2.0 |
| 2020 | 7.6 | 7.9 | 6.3 | 5.0 | 5.6 | 3.7 | 1.2 |
| 2021 | 11.3 | 8.4 | 5.4 | 5.9 | 5.7 | 4.0 | 1.1 |
| 2022 | 11.9 | 12.3 | 7.1 | 5.1 | 4.7 | 4.6 | 1.1 |
| 2023 | 9.7 | 9.2 | 5.3 | 4.7 | 4.2 | 3.0 | 1.3 |
| 2024 | 7.0 | 7.6 | 5.4 | 3.3 | 4.3 | 2.5 | 2.1 |
| 2025 | 8.6 | 9.5 | 7.0 | 4.6 | 5.3 | 4.2 | 2.4 |
| ¹⁾ in the past 5 years | |||||||
Increase in interest in politics among younger people
While trust in politics is relatively low among older age groups, their level of interest in politics is actually higher than that of young people. 37 percent of those aged 15-17 were moderately or very interested in politics in 2025, compared to 64 percent of those aged 65-74. In 2021 (during the COVID-19 pandemic), interest in politics increased, particularly among those aged 18-24. After that, their interest declined, but increased once again in 2024 and 2025.
| Jaar | 15-17 yrs (%) | 18-24 yrs (%) | 25-34 yrs (%) | 35-44 yrs (%) | 45-54 yrs (%) | 55-64 yrs (%) | 65-74 yrs (%) | 75 yrs and older (%) |
|---|---|---|---|---|---|---|---|---|
| 2016 | 28.2 | 39.9 | 44.1 | 50.5 | 51.3 | 55.9 | 57.5 | 51.1 |
| 2017 | 30.5 | 47.7 | 47.6 | 48.1 | 51.9 | 56.6 | 58.1 | 51.5 |
| 2018 | 31.9 | 42.6 | 44.3 | 49.7 | 50.4 | 54.6 | 54.7 | 50.3 |
| 2019 | 30.9 | 42.8 | 44.1 | 49.0 | 52.7 | 52.2 | 60.4 | 51.4 |
| 2020 | 27.0 | 45.3 | 49.8 | 49.1 | 53.2 | 54.3 | 57.1 | 54.8 |
| 2021 | 29.0 | 54.0 | 51.2 | 53.7 | 58.4 | 58.3 | 59.7 | 56.9 |
| 2022 | 31.9 | 45.0 | 50.2 | 49.7 | 53.9 | 56.7 | 62.8 | 58.0 |
| 2023 | 29.0 | 43.3 | 49.6 | 51.2 | 54.4 | 59.1 | 63.8 | 55.5 |
| 2024 | 34.8 | 48.4 | 52.0 | 48.5 | 55.7 | 59.8 | 63.6 | 61.1 |
| 2025 | 37.0 | 50.7 | 50.3 | 50.9 | 56.4 | 61.8 | 64.2 | 62.0 |