Production and export of electricity at record levels
- Electricity production was up by 10 percent in 2025, year on year.
- Production from solar energy, natural gas and coal increased significantly.
- Electricity exports also reached a new high.
Energy companies and other producers in the Netherlands generated a total of 132 billion kWh of electricity in 2025. That was the most ever. After years of decline, production from fossil fuels increased once again. Electricity generated from solar energy was also up, while electricity exports reached a new high. This is reported by Statistics Netherlands (CBS) on the basis of new figures.
Electricity production has increased significantly over the past decade. In 2025, energy companies and other producers, such as operators of wind and solar parks and households with solar panels, produced a quarter more electricity than in 2015. This increase is mainly due to higher demand from other countries. As a result, more electricity was exported and less was imported. In addition, more of the demand for electricity in the Netherlands was met through domestic production. Total electricity consumption in the Netherlands is now hardly growing at all.
| Jaar | Fossil fuels (billion kWh) | Renewables (billion kWh) | Nuclear + Other (billion kWh) |
|---|---|---|---|
| 2015 | 87.476 | 13.091 | 5.186 |
| 2016 | 91.881 | 14.168 | 5.007 |
| 2017 | 91.909 | 16.827 | 4.721 |
| 2018 | 88.754 | 18.235 | 3.853 |
| 2019 | 91.619 | 22.048 | 4.193 |
| 2020 | 83.731 | 31.782 | 4.326 |
| 2021 | 74.942 | 38.888 | 4.089 |
| 2022 | 66.285 | 46.511 | 4.479 |
| 2023 | 58.061 | 55.482 | 4.286 |
| 2024 | 55.515 | 60.675 | 4.036 |
| 2025* | 63.017 | 64.278 | 4.473 |
| * provisional figures | |||
Increasing production from solar energy
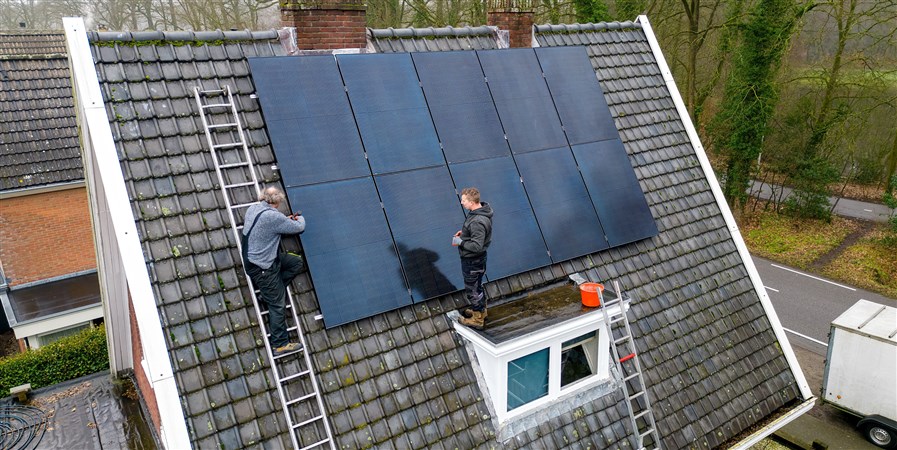
Around 17 percent more electricity was produced from solar energy in 2025 compared with 2024. This is mainly because 2025 was a very sunny year, but the total installed capacity of solar panels was also higher (by 4 percent). The amount of electricity produced from solar energy has increased more than twentyfold over the past decade.
Less electricity was produced from onshore wind energy. Less favourable wind conditions on land were an important reason for this. At the end of 2025, the total installed capacity for wind energy was 7.0 GW onshore and 4.7 GW offshore. More electricity was generated from offshore wind in 2025 than in 2024. This was largely because the new wind farms that came online in 2024 were producing energy for the whole year in 2025.
More electricity was also produced from biomass, which was used to co-fire coal power stations, for instance.
Total electricity production from renewable sources was slightly higher: up by 6 percent on 2024. Compared to 2015, it was almost five times higher. Renewable sources accounted for 49 percent of total electricity production in 2025, and were the most important source of electricity production – just as they were in 2024.
| Jaar | Solar (billion kWh) | Onshore wind (billion kWh) | Offshore wind (billion kWh) | Biomass (billion kWh) | Hydro (billion kWh) |
|---|---|---|---|---|---|
| 2015 | 1.109 | 6.420 | 1.130 | 4.339 | 0.093 |
| 2016 | 1.602 | 5.901 | 2.269 | 4.296 | 0.100 |
| 2017 | 2.204 | 6.869 | 3.700 | 3.993 | 0.061 |
| 2018 | 3.708 | 6.918 | 3.630 | 3.906 | 0.072 |
| 2019 | 5.399 | 7.935 | 3.573 | 5.067 | 0.074 |
| 2020 | 8.567 | 9.794 | 5.484 | 7.891 | 0.046 |
| 2021 | 11.304 | 9.813 | 7.865 | 9.817 | 0.088 |
| 2022 | 16.657 | 13.134 | 7.936 | 8.733 | 0.050 |
| 2023 | 19.607 | 17.482 | 11.553 | 6.771 | 0.069 |
| 2024 | 21.822 | 17.657 | 15.182 | 5.929 | 0.085 |
| 2025* | 25.520 | 16.423 | 15.614 | 6.664 | 0.057 |
| * provisional figures | |||||
More electricity produced from natural gas and coal
Electricity generated using fossil fuels was up by 14 percent year on year. A total of 48 percent of electricity production came from fossil fuels.
Compared to 2024, 11 percent more electricity was produced using natural gas, and 25 percent more was produced using coal. Over the longer term, however, electricity production using coal has fallen and was 70 percent lower in 2025 than it was in 2015.
| Jaar | Natural gas (billion kWh) | Coal (billion kWh) | Oil derivatives & + other non-renewable fuels (billion kWh) |
|---|---|---|---|
| 2015 | 44.567 | 40.195 | 2.714 |
| 2016 | 51.422 | 37.762 | 2.697 |
| 2017 | 56.596 | 32.737 | 2.576 |
| 2018 | 56.462 | 29.318 | 2.974 |
| 2019 | 69.407 | 19.250 | 2.962 |
| 2020 | 71.196 | 9.601 | 2.934 |
| 2021 | 55.520 | 16.497 | 2.925 |
| 2022 | 46.672 | 16.481 | 3.132 |
| 2023 | 44.976 | 10.146 | 2.939 |
| 2024 | 43.232 | 9.586 | 2.697 |
| 2025* | 47.958 | 11.960 | 3.099 |
| * provisional figures | |||
Electricity exports up by a quarter
Electricity exports reached a record high in 2025, at 30 billion kWh. That was a rise of a quarter compared to 2024. Exports to Germany and Belgium increased, in particular.
Exports of electricity to Germany increased by almost half. The main reasons for this was reduced wind power production off the German coast and reduced production in Switzerland and Austria due to lower water levels.
Exports to Belgium increased by almost a quarter. A major cause of this was reduced electricity production in Belgian nuclear power plants.
Electricity imports fell by 19 percent, particularly from Germany, Belgium and Norway. Dutch electricity imports have almost halved over the past decade. The main reason for this is that the Netherlands is generating ever more electricity of its own.
| Jaar | Net import/export (billion kWh) | Import (billion kWh) | Export (billion kWh) |
|---|---|---|---|
| 2015 | 8.748 | 30.760 | -22.012 |
| 2016 | 4.915 | 24.258 | -19.343 |
| 2017 | 3.506 | 22.458 | -18.952 |
| 2018 | 7.970 | 26.755 | -18.785 |
| 2019 | 0.855 | 20.403 | -19.548 |
| 2020 | -2.660 | 19.773 | -22.433 |
| 2021 | 0.253 | 20.885 | -20.632 |
| 2022 | -4.267 | 18.544 | -22.811 |
| 2023 | -5.659 | 19.547 | -25.206 |
| 2024 | -4.221 | 20.028 | -24.249 |
| 2025* | -14.048 | 16.307 | -30.355 |
| * provisional figures | |||
Sources
- StatLine - Electricity balance sheet; supply and consumption
- StatLine - Renewable electricity; production and capacity
- StatLine - Average energy prices for consumers
Related items
- Website - Royal Netherlands Meteorological Institute (KNMI)
- Eurostat - Net electricity generation by type of fuel - monthly data
- Website - IEA - Switzerland
- Website - IEA - Austria
- Website - Swissgrid
- Website - Swiss Energy research for the energy transition
- Wesbite - Verbund: Declining earnings due to signifcantly below-average water supply and extension of windfall tax in Austria