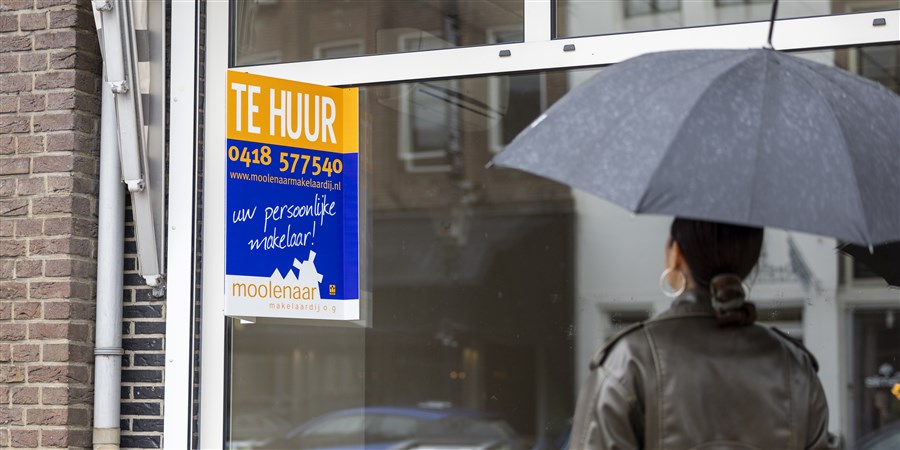
Contraction of the private rental sector in 2024
| Type woning | 2021 (x 1,000) | 2022 (x 1,000) | 2023 (x 1,000) | 2024 (x 1,000) |
|---|---|---|---|---|
| Owner-occupied homes | 46.170 | 35.095 | 49.760 | 65.955 |
| Homes ownd by a housing association | 3.530 | 6.620 | 8.260 | 9.685 |
| Privately-owned rental homes | 25.425 | 37.080 | 27.150 | -3.200 |
| Source: CBS, Kadaster | ||||
Number of rental homes owned by businesses and other organisations increased
Private rental properties can be owned by natural persons (private individuals), private limited companies under Dutch law (BV) and public limited companies (NV) or other non-natural persons, such as foundations and associations. The number of rental properties owned by companies rose by 12 thousand to 419 thousand in 2024, and the number of homes owned by foundations and associations increased by 7 thousand to 235 thousand. By contrast, the number of rental properties owned by private individuals fell by 22 thousand to 529 thousand.| Eigenaar | 2021 (x 1,000) | 2022 (x 1,000) | 2023 (x 1,000) | 2024 (x 1,000) |
|---|---|---|---|---|
| Private individuals | 8.880 | 9.130 | -0.480 | -22.350 |
| Companies | 8.945 | 21.660 | 21.875 | 12.330 |
| Other, non-natural persons | 7.600 | 6.290 | 5.755 | 6.820 |
| Source: CBS, Kadaster | ||||
Rental homes owned by private individuals mainly transferred to other types of owners
The decrease in the number of privately-owned rental properties was mainly due to sales and other transfers of ownership to the owner-occupied housing sector: 23 thousand in total. In addition, 5 thousand privately-owned rental properties were transferred to rental properties owned by non-natural persons (companies, housing associations and other organisations). Due to additions and withdrawals (such as more new-build homes, demolition and splitting or transformation of properties), the number of privately-owned rental homes rose by nearly 6 thousand. A total of 34 thousand new-build homes were bought by non-natural persons and nearly 30 thousand homes were added to the owner-occupied housing sector.| Type woning | Transfers of owner-occupied homes (x 1,000) | Transfers of rental homes owned by non-natural persons (x 1,000) | Transfers of rental homes owned by private individuals (x 1,000) | Additions and withdrawals (including new-builds, demolitions, transformations) (x 1,000) |
|---|---|---|---|---|
| Owner-occupied homes | 0 | 12.355 | 22.995 | 29.975 |
| Rental properties owned by non-natural persons | -12.355 | 0 | 5.295 | 34.310 |
| Rental properties owned by private individuals | -22.995 | -5.295 | 0 | 5.655 |
| Source: CBS, Kadaster | ||||
Most transfers from privately-owned rental homes to owner-occupied homes were seen in the Randstad conurbation
In Utrecht and North Holland, more than 5 percent of privately-owned rental homes transferred ownership to buyers in the owner-occupied housing sector. The share was smallest in Zeeland and Limburg, at over 2 percent.
In the four major cities, the number of transfers of ownership from private rental housing to the owner-occupied housing sector was the highest in Utrecht (6.0 percent) and the lowest in Rotterdam (3.9 percent). In The Hague, it was 4.8 percent and in Amsterdam 5.0 percent.
| Provincie | Change in private rental housing to owner-occupied housing, 2024 (%) |
|---|---|
| Drenthe | 4.1 |
| Flevoland | 3.7 |
| Fryslân | 3.6 |
| Gelderland | 4.2 |
| Groningen | 3.4 |
| Limburg | 2.3 |
| Noord-Brabant | 3.7 |
| Noord-Holland | 5.1 |
| Overijssel | 3.3 |
| Utrecht | 5.5 |
| Zeeland | 2.3 |
| Zuid-Holland | 4.5 |
| Source: CBS, Kadaster | |