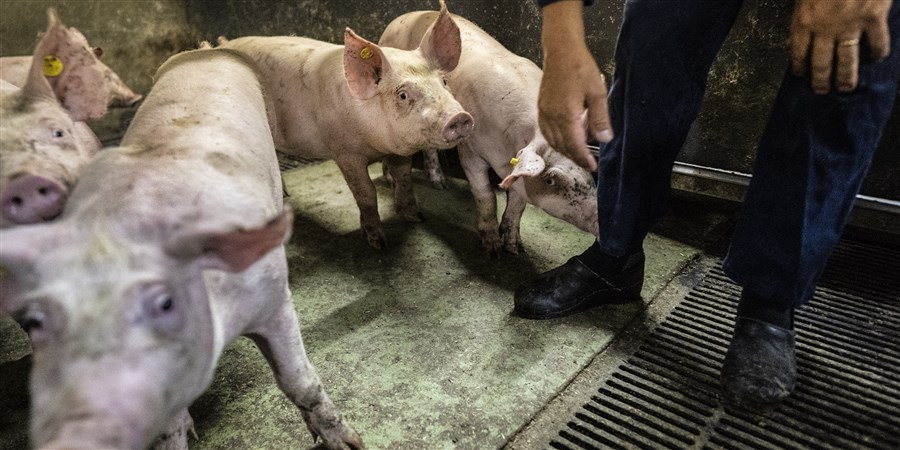
Pig population falls below 10 million for the first time in 45 years
| Periode | Pigs (x million) |
|---|---|
| 1975 | 7.28 |
| 1976 | 7.51 |
| 1977 | 8.29 |
| 1978 | 9.17 |
| 1979 | 9.72 |
| 1980 | 10.14 |
| 1981 | 10.32 |
| 1982 | 10.25 |
| 1983 | 10.66 |
| 1984 | 11.15 |
| 1985 | 12.38 |
| 1986 | 13.48 |
| 1987 | 14.35 |
| 1988 | 13.93 |
| 1989 | 13.73 |
| 1990 | 13.92 |
| 1991 | 13.22 |
| 1992 | 14.16 |
| 1993 | 14.96 |
| 1994 | 14.57 |
| 1995 | 14.40 |
| 1996 | 14.42 |
| 1997 | 15.19 |
| 1998 | 13.45 |
| 1999 | 13.57 |
| 2000 | 13.12 |
| 2001 | 13.07 |
| 2002 | 11.65 |
| 2003 | 11.17 |
| 2004 | 11.15 |
| 2005 | 11.31 |
| 2006 | 11.36 |
| 2007 | 11.66 |
| 2008 | 12.03 |
| 2009 | 12.19 |
| 2010 | 12.26 |
| 2011 | 12.43 |
| 2012 | 12.23 |
| 2013 | 12.21 |
| 2014 | 12.24 |
| 2015 | 12.60 |
| 2016 | 12.48 |
| 2017 | 12.40 |
| 2018 | 12.43 |
| 2019 | 12.27 |
| 2020 | 11.95 |
| 2021 | 11.46 |
| 2022 | 11.28 |
| 2023 | 10.83 |
| 2024 | 10.49 |
| 2025* | 9.96 |
| *provisional figures | |
On 1 April 2025, there were 1.9 thousand agricultural holdings that rear pigs, 7.1 percent fewer than the previous year. Small livestock farms with fewer than 500 pigs (-10.9 percent) and farms with 2 thousand to 5 thousand pigs (-10.4 percent) in particular, have ceased rearing pigs.
94 percent of all pigs are raised on livestock farms. Other farms with pigs include multi-species livestock farms and mixed crop-livestock farms.
In recent years, pig farmers were eligible for various schemes if they decided to cease their operations permanently, such as the Subsidy scheme for the Remediation of Pig farms (SRV) and the buy-out scheme for livestock farmers.
The number of small pig farms decreased by two-thirds in ten years
The number of livestock farms that rear pigs has nearly halved (45.9 percent) since 2015. The number of medium-sized farms (with five hundred to two thousand pigs and two to five thousand pigs) has halved.Compared to 2015, only a third of small farms (up to 500 pigs) are still in business. Over the past ten years, the number of large farms with more than five thousand pigs has remained the most stable.
Number of pigs per farm rose by nearly 50 percent in ten years
Smaller farms in particular have ceased rearing pigs, which led to an increase in the average number of pigs per farm to five thousand in 2025. This was an increase of nearly 50 percent compared to 2015 and 2.4 percent compared to 2024.
| Periode | Fewer than 500 pigs | Five hundred- two thousand | Two thousand-five thousand | Five thousand pigs or more |
|---|---|---|---|---|
| 2015 | 571 | 1049 | 1142 | 701 |
| 2016 | 481 | 930 | 1096 | 719 |
| 2017 | 442 | 859 | 1033 | 728 |
| 2018 | 440 | 860 | 969 | 738 |
| 2019 | 416 | 786 | 936 | 720 |
| 2020 | 282 | 675 | 888 | 736 |
| 2021 | 256 | 603 | 769 | 715 |
| 2022 | 216 | 552 | 737 | 715 |
| 2023 | 195 | 535 | 660 | 692 |
| 2024 | 201 | 512 | 637 | 668 |
| 2025* | 179 | 493 | 571 | 632 |
Decrease in the dairy cow population, particularly in young stock
On 1 April 2025, there were 3.65 million cattle in the Netherlands, 3.3 percent fewer than the previous year. The number of young stock for dairy farming fell in particular, by 6.3 percent. Young stock are calves and heifers that are being raised to eventually replace older cows in the dairy herd. Compared to 2015, the young livestock herd has shrunk by a third.A total of 42 percent of all cattle in 2025 were dairy cows. The number of dairy cows in 2025 was down by 1.0 percent from 2024, and by 5.8 percent from 2015.
Number of dairy farms down by over a quarter in ten years
In 2025, the number of dairy farms fell by 3.7 percent, year on year, to a total of 13.4 thousand. That was a decrease of 25.9 percent compared to 2015.In 2017, the phosphate reduction plan came into force in the Dutch dairy farming sector. Under this plan, farmers had to reduce the size of their dairy herds, bringing an end to rising numbers of cattle.
Decrease in number of veal calves continues
The population of veal calves fell by 4.2 percent to 964 thousand, year on year. Compared to 2015, however, the population of veal calves has increased by 6.0 percent, but it has seen declines in the last five years.The number of farms with veal calves also fell. In 2025, there were 6.1 percent fewer businesses than in 2024. That represents a decline of 28.7 since 2015.
| Periode | Dairy and veal cows (>= 2 years) (x million) | Young stock for dairy farming (x million) | Veal calves (x million) | Young stock for meat production (x million) | Other types of cows (x million) | Bulls (>= 2 years) (x million) |
|---|---|---|---|---|---|---|
| 2025* | 1.53 | 0.91 | 0.96 | 0.19 | 0.05 | 0.01 |
| 2024 | 1.54 | 0.97 | 1.01 | 0.19 | 0.05 | 0.01 |
| 2023 | 1.57 | 0.99 | 1.02 | 0.19 | 0.05 | 0.01 |
| 2022 | 1.57 | 0.98 | 1.04 | 0.17 | 0.05 | 0.01 |
| 2021 | 1.57 | 0.97 | 1.05 | 0.17 | 0.06 | 0.01 |
| 2020 | 1.59 | 0.94 | 1.07 | 0.17 | 0.06 | 0.01 |
| 2019 | 1.58 | 0.92 | 1.07 | 0.17 | 0.06 | 0.01 |
| 2018 | 1.62 | 1.03 | 1.02 | 0.17 | 0.06 | 0.01 |
| 2017 | 1.69 | 1.2 | 0.95 | 0.17 | 0.06 | 0.02 |
| 2016 | 1.74 | 1.32 | 0.96 | 0.15 | 0.07 | 0.01 |
| 2015 | 1.62 | 1.34 | 0.91 | 0.17 | 0.08 | 0.01 |
| *provisional figures | ||||||
More cattle per farm
The average number of cattle per farm has been increasing over the last few years. In 2025, there were an average of 114 dairy cows per dairy farm, compared to 111 in 2024. In 2015, the average was 89 cows per farm.The average number of veal calves per farm rose to 708, nearly twice as many as ten years ago, when it was 476.