More greenhouse gas emissions in Q1 2025
| Sector | Year | CO2 (megatonnes of CO2-equivalent) | Other greenhouse gases (megatonnes of CO2-equivalent) |
|---|---|---|---|
| Total IPCC | 2025 | 36.7 | 6.7 |
| Total IPCC | 2024 | 33.8 | 6.7 |
| Manufacturing | 2025 | 10.5 | 1.2 |
| Manufacturing | 2024 | 10.6 | 1.2 |
| Electricity | 2025 | 8.6 | 0.1 |
| Electricity | 2024 | 6.2 | 0 |
| Buildings and construction | 2025 | 7.7 | 0.2 |
| Buildings and construction | 2024 | 7.2 | 0.2 |
| Agriculture | 2025 | 2.3 | 4.9 |
| Agriculture | 2024 | 2.1 | 4.9 |
| Mobility | 2025 | 6.7 | 0.2 |
| Mobility | 2024 | 7.1 | 0.2 |
| Land use | 2025 | 0.8 | 0.2 |
| Land use | 2024 | 0.6 | 0.2 |
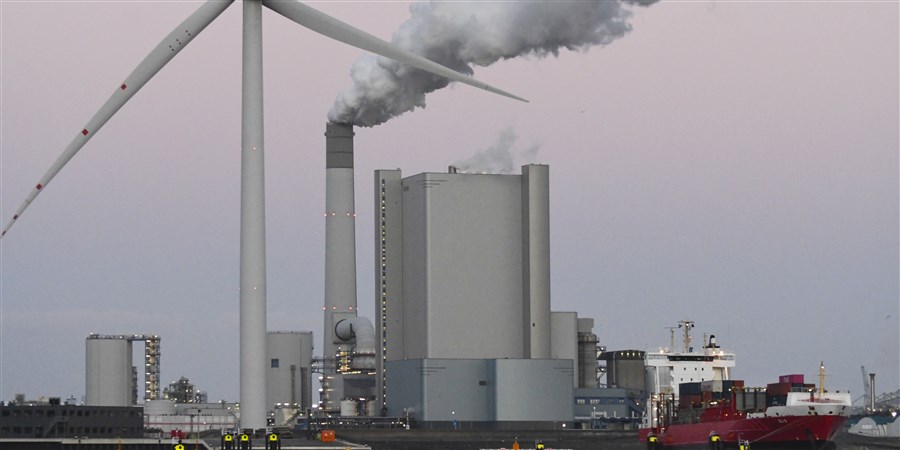
Greenhouse gas emissions from the electricity sector 40 percent higher
Greenhouse gas emissions from the electricity sector were 40 percent higher in Q1 2025 than in Q1 2024. The sector produced more electricity because less electricity was imported from neighbouring countries, Belgium and Germany in particular, and more was exported. In addition, less was produced from renewable sources, because there was less wind.
Energy companies mainly consumed more coal, which leads to more emissions than the use of natural gas. CO2 emissions from coal consumption are higher than from natural gas for the same amount of electricity produced. The share of the electricity sector in total greenhouse gas emissions in Q1 2025 was 20 percent, compared with 15 percent in Q1 2024.
Emissions from the built environment were also higher
Emissions by the built environment sector were 7 percent higher in Q1 2025 than in Q1 2024. The first three months of 2025 were mild, but less mild than the same months in 2024. As a result, more natural gas was needed to heat homes and buildings.
Less emissions from the mobility sector
However, the mobility sector emitted 5 percent less in Q1 2025. This was mainly due to lower sales of diesel. More fuel was refueled abroad, because diesel is cheaper in Luxembourg and Germany than in the Netherlands and the price difference became greater. In addition, diesel cars of business drivers who drive more kilometres than average were replaced by fully electric and plug-in hybrid cars. The contribution of this sector to total emissions decreased from 18 percent in the first quarter of 2024 to 16 percent in 2025.
| Categories | Share |
|---|---|
| Manufacturing | 27.1 |
| Electricity | 19.9 |
| Buildings and construction | 18.3 |
| Agriculture | 16.5 |
| Mobility | 15.9 |
| Land use | 2.3 |
CBS also calculates CO2 emissions from all domestic economic activities according to the national accounts. Compared to emissions according to the IPCC definitions, this also includes CO2 emissions from international air and sea transport and emissions from the combustion of biomass. In the news release below, CO2 emissions are described in accordance with the calculation method set out in the national accounts.
CO2 emissions from the Dutch economy nearly 8 percent higher
The Dutch economy emitted 7.7 percent more CO2 in Q1 2025 than in Q1 2024, while gross domestic product (GDP) increased by 2.0 percent over the same period. The increase in CO2 emissions was mainly due to higher usage of coal and natural gas by power stations. After adjusting for weather conditions, the incline in CO2 emissions by the Dutch economy was 3.6 percent.
The transport sector emitted 4.2 percent more CO2 than in Q1 2025, while the value added grew by 2.0 percent. This was mainly due to higher emissions by aviation and maritime transport.
In Q1, CO2 emissions from the agriculture, mining and quarrying, manufacturing and construction sectors were around the same level as in Q1 2024. The added value of this cluster was 3.6 percent higher. Emissions from the agriculture, construction and basic metals industries were higher, while emissions from the petroleum and chemical industries were lower.
| Categories | CO2-emissions (year-on-year volume change in %) | Value added (year-on-year volume change in %) | GDP (year-on-year volume change in %) |
|---|---|---|---|
| Total (weather adjusted) | 3.6 | ||
| Total | 7.7 | 2 | |
| Energy and water supply, waste management | 28.7 | 2.3 | |
| Transport sector | 4.2 | 2 | |
| Households | 3.6 | ||
| Other services | 0.3 | 1.5 | |
| Agriculture, mining, manufacturing and construction | 0.2 | 3.6 | |