More fish landings at domestic ports in 2021
Trawlers landed 404.1 million kg of fish last year. These fishing vessels with funnel-shaped nets concentrate on schools of fish swimming in deeper waters. In 2021, they mainly landed blue whiting (34 percent), herring (33 percent) and mackerel (18 percent). Landings by trawlers were 20 percent higher than a year previously, with more horse mackerel in particular being delivered to Dutch ports (+101 percent). After 2014, particularly trawler catches of herring, mackerel, blue whiting and sardines increased. Cutters focus on bottom fishing in coastal waters. These vessels landed 39.3 million kg of fish in 2021, mostly plaice (44 percent) and North Sea shrimps (34 percent). Landings were 4 percent less than the previous year, whereas cod landings actually surged, by 126 percent. After 2014, cutters’ catches of most species of fish decreased.
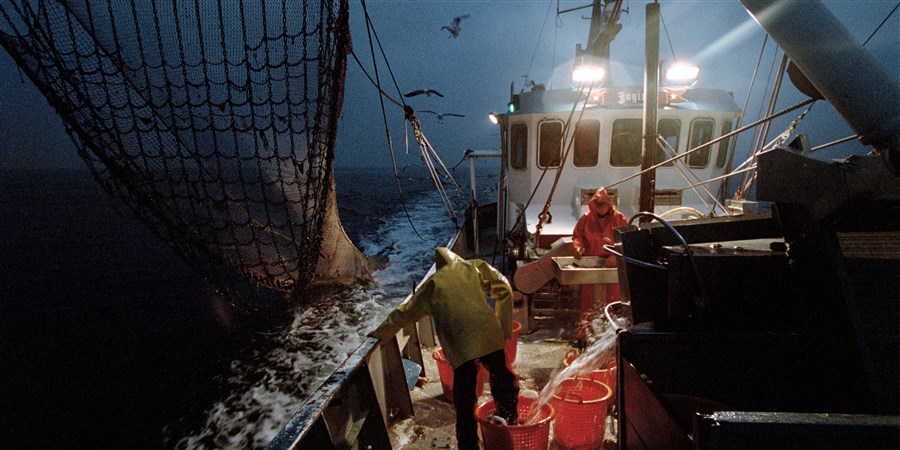
Cutters land fresh fish
Jaartal Fishing trawlers (million kg) Cutters (million kg) 2002 398.3 97.1 2003 468.5 97.6 2004 493.8 92.9 2005 546.1 86.2 2006 504.9 77.8 2007 453.9 79.2 2008 371.2 78.2 2009 336.0 86.2 2010 337.1 72.8 2011 283.4 68.1 2012 284.0 58.3 2013 223.8 59.0 2014 205.8 54.1 2015 462.6 78.2 2016 321.4 62.3 2017 423.6 53.9 2018 448.0 59.4 2019 371.3 43.7 2020 336.6 41.1 2021* 404.1 39.3 * Provisional figures
Low point in 2014
The amount of fish landed bottomed at 260 million kg in 2014, mainly because trawlers landed fewer and fewer fish. In 2015, this downward trend was broken and fishing yields doubled relative to one year previously. This level was no longer reached after 2015 although yields remained higher than in 2014.
More cod and horse mackerel in 2021
Over the years, there have been strong fluctuations in landings for each species of fish. Landings of horse mackerel and cod were up in 2021 compared to one year previously while there was still a decline the year before.
In contrast, quantities of North Sea shrimps (-9 percent) and sardines (-5 percent) showed a decline. The quantity of landed fish is largely determined by fishing quotas (catch limits) which are set per fish species under the EU’s Common Fisheries Policy (CFP).
| Soort | Year-on-year % change (year-on-year % change) |
|---|---|
| Cod | 126.8 |
| Horse mackerel | 101.3 |
| Blue whiting | 23.0 |
| Herring | 14.2 |
| Mackerel | 7.9 |
| Sole | -3.5 |
| Plaice | -4.1 |
| Sardines | -5.2 |
| North Sea shrimps | -9.0 |
Price of sole at record high in August 2022
Prices of commercially important fish species rose especially in 2022. Prices fluctuate during the season, depending on the period when a given species is fished in an area and landed. In addition, fuel prices have risen over the past year in particular.
The price of sole peaked in August 2022, at 18,738 euros per tonne, 43 percent up on one year previously. North Sea shrimp prices were highest in April, at 8,083 euros per tonne. This is 35 percent higher than in the previous year.
| Jaartal | Maand | Sole (1,000 euros per tonne) | North Sea shrimps (1,000 euros per tonne) | Cod (1,000 euros per tonne) | Plaice (1,000 euros per tonne) |
|---|---|---|---|---|---|
| 2017 | January | 10.00 | 8.96 | 2.96 | 1.57 |
| 2017 | February | 9.84 | 8.89 | 2.83 | 1.49 |
| 2017 | March | 9.28 | 9.89 | 1.81 | 1.78 |
| 2017 | April | 8.93 | 10.74 | 2.49 | 1.72 |
| 2017 | May | 11.70 | 12.05 | 2.64 | 1.78 |
| 2017 | June | 11.49 | 12.44 | 2.85 | 1.72 |
| 2017 | July | 12.03 | 11.34 | 3.22 | 1.93 |
| 2017 | August | 11.85 | 7.53 | 3.35 | 1.96 |
| 2017 | September | 12.29 | 4.92 | 3.83 | 2.00 |
| 2017 | October | 11.48 | 4.36 | 3.30 | 2.26 |
| 2017 | November | 10.78 | 5.26 | 2.45 | 2.45 |
| 2017 | December | 11.16 | 6.09 | 2.93 | 2.62 |
| 2018 | January | 12.77 | 6.84 | 2.40 | 1.91 |
| 2018 | February | 12.18 | 8.47 | 2.46 | 2.15 |
| 2018 | March | 11.33 | 9.34 | 2.24 | 2.49 |
| 2018 | April | 10.35 | 9.78 | 2.47 | 2.43 |
| 2018 | May | 12.21 | 9.35 | 2.83 | 2.47 |
| 2018 | June | 12.85 | 5.90 | 2.78 | 2.53 |
| 2018 | July | 12.45 | 2.90 | 2.74 | 2.61 |
| 2018 | August | 10.92 | 2.72 | 3.33 | 2.66 |
| 2018 | September | 12.12 | 2.72 | 3.49 | 2.91 |
| 2018 | October | 10.86 | 2.74 | 2.94 | 3.02 |
| 2018 | November | 10.88 | 2.73 | 2.48 | 2.85 |
| 2018 | December | 12.05 | 2.73 | 2.71 | 2.57 |
| 2019 | January | 11.35 | 2.69 | 2.41 | 2.18 |
| 2019 | February | 10.92 | 2.63 | 2.18 | 2.24 |
| 2019 | March | 11.51 | 2.61 | 2.46 | 2.70 |
| 2019 | April | 10.14 | 2.66 | 2.29 | 2.69 |
| 2019 | May | 11.28 | 2.72 | 2.90 | 2.31 |
| 2019 | June | 12.64 | 2.70 | 3.07 | 2.27 |
| 2019 | July | 11.71 | 2.69 | 3.16 | 2.41 |
| 2019 | August | 11.86 | 2.58 | 3.64 | 2.48 |
| 2019 | September | 12.00 | 2.53 | 3.62 | 2.64 |
| 2019 | October | 12.82 | 2.79 | 3.14 | 2.72 |
| 2019 | November | 12.72 | 3.01 | 2.77 | 2.52 |
| 2019 | December | 13.66 | 3.51 | 3.40 | 2.39 |
| 2020 | January | 14.54 | 3.93 | 3.49 | 2.05 |
| 2020 | February | 14.43 | 4.45 | 3.12 | 2.20 |
| 2020 | March | 11.75 | 4.64 | 2.96 | 2.18 |
| 2020 | April | 9.60 | 4.48 | 2.49 | 1.96 |
| 2020 | May | 11.72 | 4.38 | 3.05 | 1.98 |
| 2020 | June | 11.61 | 4.17 | 3.59 | 1.98 |
| 2020 | July | 10.63 | 3.54 | 3.53 | 2.14 |
| 2020 | August | 9.99 | 2.74 | 4.14 | 2.26 |
| 2020 | September | 8.61 | 2.79 | 4.23 | 2.34 |
| 2020 | October | 8.16 | 2.73 | 2.81 | 2.30 |
| 2020 | November | 7.50 | 2.91 | 2.96 | 2.26 |
| 2020 | December | 8.67 | 3.03 | 2.84 | 1.97 |
| 2021* | January | 9.31 | 3.25 | 3.20 | 1.73 |
| 2021* | February | 7.88 | 4.48 | 2.96 | 1.69 |
| 2021* | March | 7.62 | 5.66 | 3.13 | 1.83 |
| 2021* | April | 9.04 | 5.98 | 2.61 | 2.19 |
| 2021* | May | 13.21 | 5.84 | 2.94 | 2.16 |
| 2021* | June | 11.57 | 5.70 | 3.15 | 2.14 |
| 2021* | July | 12.97 | 4.92 | 3.92 | 2.30 |
| 2021* | August | 13.09 | 3.10 | 3.62 | 2.42 |
| 2021* | September | 11.93 | 2.80 | 3.41 | 2.60 |
| 2021* | October | 13.02 | 3.07 | 3.55 | 2.68 |
| 2021* | November | 13.03 | 3.54 | 3.20 | 2.64 |
| 2021* | December | 13.36 | 4.10 | 2.63 | 2.41 |
| 2022* | January | 14.32 | 4.95 | 4.04 | 2.12 |
| 2022* | February | 13.90 | 5.55 | 4.04 | 2.83 |
| 2022* | March | 14.00 | 7.26 | 2.92 | 2.52 |
| 2022* | April | 14.83 | 8.08 | 3.01 | 2.55 |
| 2022* | May | 16.36 | 8.02 | 3.08 | 2.81 |
| 2022* | June | 18.21 | 7.58 | 3.58 | 2.93 |
| 2022* | July | 18.39 | 6.40 | 4.47 | 3.14 |
| 2022* | August | 18.74 | 5.46 | 4.70 | 3.27 |
| 2022* | September | 16.94 | 5.43 | 4.16 | 3.28 |
| 2022* | October | 17.11 | 5.17 | 4.15 | 3.47 |
| * Provisional figures | |||||
Sources
- Publication - The Netherlands in numbers, 2022