Seaport throughput down by over 8 percent in 2020
| Jaar | Inbound cargo (x million tonnes) | Outbound cargo (x million tonnes) | Total (x million tonnes) |
|---|---|---|---|
| 2000 | 315.85 | 89.95 | 405.80 |
| 2001 | 317.33 | 88.52 | 405.85 |
| 2002 | 318.09 | 95.22 | 413.31 |
| 2003 | 318.49 | 91.84 | 410.33 |
| 2004 | 339.51 | 101.21 | 440.72 |
| 2005 | 350.95 | 109.99 | 460.94 |
| 2006 | 358.91 | 118.33 | 477.24 |
| 2007 | 377.13 | 130.34 | 507.46 |
| 2008 | 396.73 | 133.63 | 530.36 |
| 2009 | 342.77 | 140.37 | 483.13 |
| 2010 | 386.34 | 152.37 | 538.70 |
| 2011 | 387.08 | 163.66 | 550.74 |
| 2012 | 385.93 | 171.33 | 557.26 |
| 2013 | 387.10 | 171.45 | 558.54 |
| 2014 | 396.81 | 174.82 | 571.64 |
| 2015 | 406.67 | 187.60 | 594.27 |
| 2016 | 398.28 | 190.49 | 588.77 |
| 2017 | 401.33 | 194.48 | 595.81 |
| 2018 | 407.51 | 197.03 | 604.54 |
| 2019 | 411.61 | 195.92 | 607.52 |
| 2020 | 365.32 | 192.26 | 557.58 |
Last year, the transhipment of unloaded goods, i.e. 65.5 percent of total throughput, was 11.2 percent lower than in 2019. Outbound sea freight declined in weight by 1.9 percent. As for inbound shipments, the largest decrease was seen in dry bulk at 19.9 percent. There were mainly fewer shipments of coal (-34.7 percent) and ores (-22.1 percent), particularly due to the sharp decline in steel production in Germany.
| goederen | Change (year-on-year % change) |
|---|---|
| Coal | -34.7 |
| Ore | -22.1 |
| Petroleum products | -14.7 |
| Other liquid bulk | -14.0 |
| Crude oil | -8.4 |
| Liquefied gas (LNG) | -6.4 |
| Agricultural products (e.g. grains, soya, tapioca) | -4.9 |
| Other dry bulk | 2.5 |
The decrease in the supply of liquid bulk was mainly caused by fewer shipments of petroleum products and crude oil; volumes dropped by 14.7 and 8.4 percent respectively year-on-year, in terms of weight. This is partly attributable to less throughput of fuel oil, gas oil and diesel. Fewer flights and less passenger traffic during the coronavirus crisis play a role here.
Less coal from Russia and the US and less ore from Brazil
In 2020, 16.5 percent of all unloaded goods in Dutch seaports came from Russia. The volume of cargo throughput from Russia declined by 13.1 percent. This was mainly because inbound coal shipments from this country dropped by 23.3 percent. Coal from the United States saw a decrease of 38.0 percent. The decline in the volume of unloaded ores (-22.1 percent) was largely on account of Brazil. The volume plummeted by 6 million tonnes (-41.6 percent), while the total decline in incoming ore shipments stood at 7.5 million tonnes.
| Land | 2020 (million tonnes) | 2019 (million tonnes) |
|---|---|---|
| Russia | 60.44 | 69.53 |
| United Kingdom | 41.27 | 40.21 |
| United States | 30.07 | 34.14 |
| Norway | 23.72 | 28.71 |
| Brazil | 20.62 | 25.48 |
| China | 15.49 | 15.47 |
| Canada | 10.16 | 11.37 |
| Egypt | 8.81 | 9.56 |
| South Africa | 8.05 | 8.52 |
| Nigeria | 7.91 | 10.55 |
Of the other countries in the top 10 of cargo throughput, only inbound shipments from the United Kingdom increased relative to 2019 (2.6 percent). This is because 16.0 percent more crude oil was shipped from the UK.
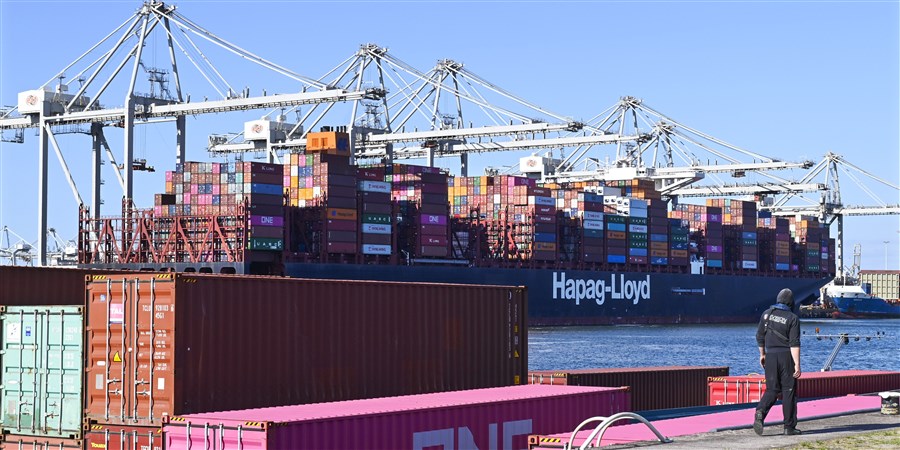
Container shipments increasing in weight, decreasing in number
While bulk goods recorded a sharp drop in throughput, container throughput increased. In 2020, the total volume of incoming and outgoing container cargo amounted to 134 million tonnes, 0.4 percent more than in 2019. Outbound container cargo rose by 1.5 percent, while inbound cargo declined slightly. In the first half of 2020, developments in inbound and outbound shipments were virtually equal, -1.1 versus -1.5 percent. In the second half of 2020, there was a clear difference; the weight of unloaded container goods was more or less the same as one year previously, while the weight of loaded cargo was 4.0 percent higher.
| Haven | Change (year-on-year % change) |
|---|---|
| Hamburg | -7.9 |
| Rotterdam | -3.1 |
| Antwerp | 1.4 |
Almost 98 percent of the containers in the Netherlands are unloaded and loaded in the Port of Rotterdam. This number is often expressed in TEU, the standard measure of a container. Rotterdam is Europe's largest container port with over 14.3 million TEUs, followed by Antwerp and Hamburg with 12.0 and 8.5 million TEUs respectively. In 2020, the number of containers handled in the Port of Rotterdam fell by 3.1 percent year-on-year. In the Port of Hamburg, it declined more sharply (by 7.9 percent) while Antwerp recorded a small increase (1.4 percent).