Gross seed onion yield 4 percent lower in 2020
| Jaartal | Sugarbeet (million tonnes) | Ware potatoes (million tonnes) | Seed onions (million tonnes) | Wheat (million tonnes) | Barley (million tonnes) |
|---|---|---|---|---|---|
| 2000 | 6.7 | 4.5 | 0.8 | 1.1 | 0.3 |
| 2001 | 5.9 | 3.6 | 0.8 | 1.0 | 0.4 |
| 2002 | 6.3 | 3.9 | 0.8 | 1.1 | 0.3 |
| 2003 | 6.2 | 3.2 | 0.8 | 1.1 | 0.3 |
| 2004 | 6.3 | 3.8 | 1.2 | 1.2 | 0.3 |
| 2005 | 5.9 | 3.2 | 1.0 | 1.2 | 0.3 |
| 2006 | 5.4 | 3.1 | 0.9 | 1.2 | 0.3 |
| 2007 | 5.5 | 3.6 | 1.1 | 1.0 | 0.3 |
| 2008 | 5.2 | 3.6 | 1.2 | 1.4 | 0.3 |
| 2009 | 5.7 | 3.6 | 1.2 | 1.4 | 0.3 |
| 2010 | 5.3 | 3.5 | 1.3 | 1.4 | 0.2 |
| 2011 | 5.9 | 3.9 | 1.6 | 1.2 | 0.2 |
| 2012 | 5.7 | 3.4 | 1.3 | 1.3 | 0.2 |
| 2013 | 5.7 | 3.5 | 1.2 | 1.3 | 0.2 |
| 2014 | 6.8 | 3.9 | 1.2 | 1.3 | 0.2 |
| 2015 | 4.9 | 3.3 | 1.4 | 1.3 | 0.2 |
| 2016 | 5.5 | 3.2 | 1.3 | 1.0 | 0.2 |
| 2017 | 8.0 | 4.0 | 1.5 | 1.1 | 0.2 |
| 2018 | 6.5 | 3.1 | 0.9 | 1.0 | 0.3 |
| 2019 | 6.6 | 3.7 | 1.4 | 1.2 | 0.2 |
| 2020* | 6.8 | 3.7 | 1.3 | 1.0 | 0.3 |
| *Provisional figures | |||||
According to these estimates, in 2020 the gross yield of seed onions stood at approximately 1.3 million tonnes (-4 percent). The weather conditions in the spring of 2020 caused slightly bigger crop failures compared to the previous year.
Last year, the crop yield of second-year onion sets was studied for the first time. These onions are not sown but planted as first-year onion bulbs. From the 6.5 thousand hectares of onion cultivation area, a yield was produced of 283 thousand tonnes or around one-fifth of the total seed onion yield.
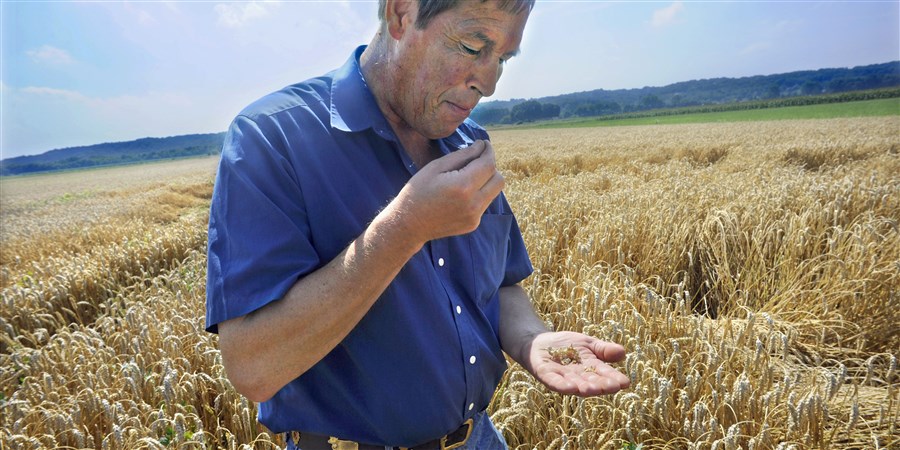
Less wheat but more barley harvested
Last year, the wheat crop yield amounted to 1 million tonnes, i.e. 17.6 percent less than in 2019. Despite a rise in summer wheat production (+70 percent), total wheat production fell year-on-year due to a reduced winter wheat yield (-22.5 percent).
The barley yield rose to 0.3 million tonnes (+1.5 percent). The higher yield is mainly due to the fact that more summer barley was harvested (+21 percent).
In 2020, the sugar beet yield increased on the previous year, to 6.8 million tonnes. This is 0.1 million tonnes or 1.6 percent more than in 2019.
The gross ware potato yield last year amounted to 3.7 million tonnes. This is roughly equal to 2019.
Summer cereal cultivation area growing
In 2020, the cultivation areas of summer wheat and summer barley showed a respective year-on-year growth of 17 thousand ha (+90 percent) and 29 thousand ha (+28 percent).
The total wheat and barley cultivation area fell by 4 percent to 148 thousand ha. This was mainly on account of a decline in the winter wheat cultivation area of 19 thousand ha.
Seed onion cultivation area has declined
In 2020, seed onion cultivation covered an area of 27.3 thousand ha. This is 0.3 thousand ha (1.1 percent) less than one year previously.
Ware potato cultivation fell by 2.7 percent last year, to 76.7 thousand ha. At the same time, the sugar beet area rose by almost 3 percent to 81.5 thousand ha.
| Jaartal | Sugarbeet (1,000 ha) | Ware potatoes (1,000 ha) | Seed onions (1,000 ha) | Wheat (1,000 ha) | Barley (1,000 ha) |
|---|---|---|---|---|---|
| 2000 | 111.00 | 87.44 | 13.99 | 136.69 | 47.17 |
| 2001 | 109.13 | 75.91 | 14.21 | 124.72 | 66.76 |
| 2002 | 108.89 | 77.21 | 14.92 | 135.85 | 56.94 |
| 2003 | 102.79 | 70.56 | 16.38 | 129.95 | 55.03 |
| 2004 | 97.74 | 72.67 | 19.89 | 138.09 | 47.99 |
| 2005 | 91.31 | 65.83 | 16.78 | 136.71 | 50.59 |
| 2006 | 82.78 | 69.48 | 18.49 | 141.12 | 44.58 |
| 2007 | 82.03 | 72.47 | 20.15 | 141.32 | 45.99 |
| 2008 | 72.23 | 69.30 | 20.30 | 156.51 | 50.23 |
| 2009 | 72.70 | 70.52 | 19.53 | 150.98 | 44.47 |
| 2010 | 70.56 | 72.97 | 22.21 | 154.01 | 33.39 |
| 2011 | 73.33 | 72.61 | 23.30 | 151.52 | 34.11 |
| 2012 | 72.72 | 67.45 | 20.99 | 151.63 | 29.84 |
| 2013 | 73.19 | 71.57 | 21.98 | 152.75 | 29.62 |
| 2014 | 75.09 | 74.07 | 22.35 | 142.21 | 27.61 |
| 2015 | 58.43 | 71.74 | 23.89 | 142.47 | 32.81 |
| 2016 | 70.72 | 73.32 | 25.08 | 128.07 | 34.80 |
| 2017 | 85.35 | 76.30 | 26.68 | 116.43 | 30.20 |
| 2018 | 85.20 | 76.35 | 25.36 | 112.04 | 36.16 |
| 2019 | 79.18 | 78.89 | 27.58 | 121.06 | 33.70 |
| 2020* | 81.46 | 76.73 | 27.28 | 109.62 | 38.68 |
| *Provisional figures | |||||
Seed onion and sugar beet: lower hectare yields than in 2019
In 2020, the sugar beet yield per hectare ended at 49 tonnes, 2.6 percent lower than in the previous year. Along with the decline in cultivation area and larger crop failures, this resulted in a lower gross yield of seed onions.
At 48.6 tonnes, the gross ware potato hectare yield was down by 1.4 percent relative to 2019. The sugar beet yield declined by 1.2 percent to an average of 82.9 tonnes per hectare.
| Jaartal | Sugarbeet (tonnes) | Ware potatoes (tonnes) | Seed onions (tonnes) | Wheat (tonnes) | Barley (tonnes) |
|---|---|---|---|---|---|
| 2000 | 61.3 | 53.1 | 62.0 | 8.4 | 6.1 |
| 2001 | 55.4 | 47.9 | 54.2 | 8.0 | 5.9 |
| 2002 | 58.2 | 51.3 | 55.1 | 7.8 | 5.5 |
| 2003 | 60.7 | 46.0 | 49.4 | 8.8 | 6.4 |
| 2004 | 64.6 | 52.6 | 62.0 | 8.9 | 6.1 |
| 2005 | 65.3 | 49.0 | 58.6 | 8.7 | 6.2 |
| 2006 | 66.0 | 44.5 | 46.4 | 8.5 | 6.1 |
| 2007 | 67.1 | 49.9 | 54.2 | 7.2 | 5.7 |
| 2008 | 72.2 | 52.4 | 60.7 | 8.7 | 6.2 |
| 2009 | 78.9 | 51.8 | 62.6 | 9.3 | 7.0 |
| 2010 | 74.8 | 49.4 | 57.5 | 8.9 | 6.1 |
| 2011 | 79.9 | 53.4 | 68.2 | 7.8 | 6.0 |
| 2012 | 78.9 | 50.2 | 63.8 | 8.6 | 6.9 |
| 2013 | 78.2 | 48.6 | 54.6 | 8.7 | 7.0 |
| 2014 | 90.8 | 52.3 | 54.6 | 9.2 | 7.1 |
| 2015 | 83.3 | 46.4 | 57.4 | 9.1 | 7.0 |
| 2016 | 77.8 | 44.4 | 52.0 | 8.0 | 6.9 |
| 2017 | 93.3 | 52.8 | 55.7 | 9.1 | 6.9 |
| 2018 | 76.4 | 41.2 | 35.5 | 8.8 | 7.0 |
| 2019 | 83.9 | 47.9 | 50.3 | 9.6 | 7.4 |
| 2020* | 82.9 | 48.6 | 49.0 | 8.8 | 6.6 |
| *Provisional figures | |||||
Provisional and definitive crop estimates
Every year in October, CBS publishes provisional crop estimates (including gross yield and hectare yield), based on expert estimates of the expected crop yield per hectare. The total gross crop yield may ultimately be higher or lower. Due to weather conditions for instance, it is possible that part of the cultivated area is not harvested or that the final yields per hectare are higher or lower.
The definitive crop estimates (including gross yield and hectare yield) over the same year are subsequently published in January of the following year and based on a survey among nearly 5 thousand crop farmers. Based on the survey, the final yield per hectare is determined as well as the crop yield ratio, i.e. the actual over the potential harvest yield.
A separate StatLine table is published to indicate the discrepancies between the definitive and provisional crop estimates, alongside the StatLine table on crop production by region.
Sources
- StatLine - Arable crops; production