Higher supermarket turnover than in week before Christmas
| Jaar | Week | Supermarket turnover (2019=100) |
|---|---|---|
| 2019 | 1 | 93.93 |
| 2019 | 2 | 93.89 |
| 2019 | 3 | 93.03 |
| 2019 | 4 | 96.53 |
| 2019 | 5 | 95.26 |
| 2019 | 6 | 94.7 |
| 2019 | 7 | 93.34 |
| 2019 | 8 | 93.87 |
| 2019 | 9 | 96.53 |
| 2019 | 10 | 97.41 |
| 2019 | 11 | 96.19 |
| 2019 | 12 | 97 |
| 2019 | 13 | 97.66 |
| 2019 | 14 | 98.18 |
| 2019 | 15 | 100.29 |
| 2019 | 16 | 109.85 |
| 2019 | 17 | 97.54 |
| 2019 | 18 | 99.48 |
| 2019 | 19 | 102.48 |
| 2019 | 20 | 99.37 |
| 2019 | 21 | 101.98 |
| 2019 | 22 | 105.55 |
| 2019 | 23 | 103.51 |
| 2019 | 24 | 104.1 |
| 2019 | 25 | 104.56 |
| 2019 | 26 | 108.62 |
| 2019 | 27 | 103.8 |
| 2019 | 28 | 99.44 |
| 2019 | 29 | 97.44 |
| 2019 | 30 | 102.07 |
| 2019 | 31 | 93.5 |
| 2019 | 32 | 94.9 |
| 2019 | 33 | 96.24 |
| 2019 | 34 | 102.04 |
| 2019 | 35 | 104.1 |
| 2019 | 36 | 100.29 |
| 2019 | 37 | 96.58 |
| 2019 | 38 | 98.65 |
| 2019 | 39 | 99.95 |
| 2019 | 40 | 99.63 |
| 2019 | 41 | 98.42 |
| 2019 | 42 | 96.93 |
| 2019 | 43 | 100.41 |
| 2019 | 44 | 104.12 |
| 2019 | 45 | 100.84 |
| 2019 | 46 | 101.26 |
| 2019 | 47 | 100.7 |
| 2019 | 48 | 101.41 |
| 2019 | 49 | 103.36 |
| 2019 | 50 | 104.75 |
| 2019 | 51 | 116.46 |
| 2019 | 52 | 107.87 |
| 2020 | 1 | 106.28 |
| 2020 | 2 | 99.41 |
| 2020 | 3 | 97.13 |
| 2020 | 4 | 100.18 |
| 2020 | 5 | 99.93 |
| 2020 | 6 | 100.01 |
| 2020 | 7 | 98.85 |
| 2020 | 8 | 99.17 |
| 2020 | 9 | 105.34 |
| 2020 | 10 | 103.25 |
| 2020 | 11 | 129.85 |
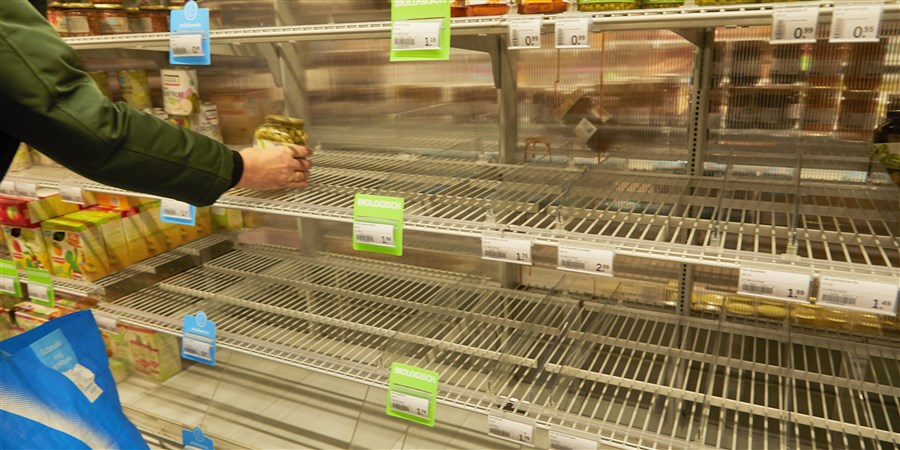
Sharpest turnover rise in shelf-stable products
In terms of percentage increase, sales of shelf-stable products such as canned goods, frozen vegetables, rice and pasta were up in particular. The sharpest increase recorded among all food products was in rice at over 150 percent, i.e. 2.5 times as high as usual.
Sales of canned vegetables as well as frozen vegetables were up by over 115 percent. By comparison, sales of fresh vegetables rose as well, but much less steeply, by nearly 30 percent.
| Productgroep | Turnover growth (year-on-year % change) |
|---|---|
| Rice | 153.5 |
| Flour and other cereals | 121.8 |
| Canned vegetables | 118.6 |
| Frozen vegetables | 116.2 |
| Canned fish and seafood | 112.1 |
| Pasta products and couscous | 98.1 |
| Baby food | 87.1 |
| Sugar | 82.6 |
| Other cereals | 81.7 |
| Preserved fruit and fruit-based products | 76.7 |
| Supermarkts, total | 35.0 |
Peak in rice sales
Sales of rice started to increase as of the last week of February. The growth initially levelled off in the first week of March but surged again in the second week of March.
Rice is included in the product group bread and cereals, as is pasta. This is the product group (among food products) which showed the highest increase in turnover at supermarkets in the second week of March.
| Week | Rice turnover increase (year-on-year % change) |
|---|---|
| 1 | 7.4 |
| 2 | 16.5 |
| 3 | 13.6 |
| 4 | 16.3 |
| 5 | 11.6 |
| 6 | 18.9 |
| 7 | 19.1 |
| 8 | 10.9 |
| 9 | 54.1 |
| 10 | 32.4 |
| 11 | 153.5 |
Run on hand soap and toilet paper
Surging demand for toilet paper and hand soap is also reflected in the supermarket turnover data. Relative to the same period last year, turnover of hand soap increased five-fold. Hand soap turnover was already rising sharply in the last week of February and the first week of March. The volume of toilet paper sales in the second week of March was more than double the volume in the same week one year previously. This product normally shows fairly stable turnover figures.
In addition, turnover of pharmaceutical products such as non-prescribed medication was up by 150 percent year-on-year in the second week of March.
| Jaar | Week | Toilet paper (2019=100) | Hand soap (2019=100) |
|---|---|---|---|
| 2019 | 1 | 112.61 | 97.53 |
| 2019 | 2 | 94.27 | 122.48 |
| 2019 | 3 | 97.62 | 119.48 |
| 2019 | 4 | 96.54 | 84.41 |
| 2019 | 5 | 93.35 | 77.6 |
| 2019 | 6 | 92.06 | 87.71 |
| 2019 | 7 | 96.84 | 93.41 |
| 2019 | 8 | 89.94 | 78.66 |
| 2019 | 9 | 91.09 | 76.48 |
| 2019 | 10 | 97 | 93.39 |
| 2019 | 11 | 96.36 | 97.02 |
| 2019 | 12 | 93.65 | 83.39 |
| 2019 | 13 | 91.37 | 82.8 |
| 2019 | 14 | 98.5 | 85.22 |
| 2019 | 15 | 89.83 | 83.28 |
| 2019 | 16 | 90.18 | 86.77 |
| 2019 | 17 | 117.39 | 90.95 |
| 2019 | 18 | 105.12 | 103.24 |
| 2019 | 19 | 113.83 | 111.4 |
| 2019 | 20 | 101.88 | 113.81 |
| 2019 | 21 | 104.12 | 92.3 |
| 2019 | 22 | 93 | 124.02 |
| 2019 | 23 | 102.85 | 92.69 |
| 2019 | 24 | 96.31 | 117.31 |
| 2019 | 25 | 101.62 | 109.59 |
| 2019 | 26 | 110.95 | 101.61 |
| 2019 | 27 | 102.34 | 122.96 |
| 2019 | 28 | 104.09 | 102.13 |
| 2019 | 29 | 104.48 | 148.46 |
| 2019 | 30 | 92.01 | 94.92 |
| 2019 | 31 | 98.36 | 108.61 |
| 2019 | 32 | 95.66 | 112.16 |
| 2019 | 33 | 97.24 | 95.36 |
| 2019 | 34 | 98.35 | 128.71 |
| 2019 | 35 | 99.51 | 105.36 |
| 2019 | 36 | 109.12 | 106.77 |
| 2019 | 37 | 97.13 | 101.69 |
| 2019 | 38 | 96.38 | 124.03 |
| 2019 | 39 | 103.65 | 104.92 |
| 2019 | 40 | 106.26 | 115.99 |
| 2019 | 41 | 96.9 | 84.97 |
| 2019 | 42 | 107.25 | 112.78 |
| 2019 | 43 | 99.07 | 105.14 |
| 2019 | 44 | 113.75 | 102.5 |
| 2019 | 45 | 103.99 | 84.4 |
| 2019 | 46 | 105.29 | 92.03 |
| 2019 | 47 | 97.85 | 104.62 |
| 2019 | 48 | 104.28 | 91.25 |
| 2019 | 49 | 106.31 | 77.32 |
| 2019 | 50 | 112.84 | 90.25 |
| 2019 | 51 | 95.62 | 93.52 |
| 2019 | 52 | 83.98 | 82.6 |
| 2020 | 1 | 105.58 | 98.93 |
| 2020 | 2 | 114.11 | 117.37 |
| 2020 | 3 | 110.88 | 81.31 |
| 2020 | 4 | 108.51 | 133.71 |
| 2020 | 5 | 98.31 | 97.82 |
| 2020 | 6 | 99.52 | 110.96 |
| 2020 | 7 | 98.64 | 84.42 |
| 2020 | 8 | 90.76 | 117.01 |
| 2020 | 9 | 117.21 | 369.18 |
| 2020 | 10 | 128.89 | 371.75 |
| 2020 | 11 | 236.08 | 507.83 |