Decline in 13 out of 20 urban bird populations

[video: https://www.cbs.nl/en-gb/video/0777ec16fbf14962b21c8b22dcd7f1a6]
(English subtitles available)
In 2015, the urban area in the Netherlands covered 16 percent of the total land area. All bird species with a population share of 32 percent or more breeding in the city are referred to as urban birds. This is the case for 20 bird species. Over the past 27 years, these populations have declined by more than half in urban areas.
| Urban area observation (1990=100) | Trend in urban areas (1990=100) | Uncertainty margin of trend in urban areas (1990=100) | Nationwide observation (1990=100) | Nationwide trend (1990=100) | Uncertainty margin of nationwide trend (1990=100) | |
|---|---|---|---|---|---|---|
| 1990 | 93.41 | 100 | 89.61 - 111.66 | 97.48 | 100 | 93.73 - 106.75 |
| 1991 | 98.64 | 95.2 | 87.84 - 104.11 | 98.25 | 96.24 | 91.88 - 101.54 |
| 1992 | 91.2 | 90.69 | 84.39 - 97.07 | 90.25 | 92.83 | 89.16 - 96.59 |
| 1993 | 90.67 | 86.44 | 81.08 - 91.42 | 93.87 | 89.73 | 86.53 - 92.80 |
| 1994 | 85.23 | 82.38 | 77.90 - 86.96 | 88.51 | 86.9 | 83.97 - 90.06 |
| 1995 | 73.71 | 78.56 | 74.10 - 83.55 | 81.52 | 84.35 | 81.49 - 87.40 |
| 1996 | 78.83 | 75.04 | 70.49 - 79.48 | 82.93 | 82.08 | 79.08 - 84.81 |
| 1997 | 77.72 | 71.63 | 67.73 - 76.36 | 84.97 | 80.01 | 76.74 - 83.14 |
| 1998 | 64.66 | 68.27 | 64.42 - 72.64 | 75.73 | 78.12 | 75.22 - 81.49 |
| 1999 | 66.11 | 65.2 | 61.28 - 69.09 | 76.41 | 76.47 | 73.73 - 79.88 |
| 2000 | 65.31 | 62.59 | 58.88 - 66.38 | 72.73 | 75.11 | 72.27 - 78.29 |
| 2001 | 56.94 | 60.44 | 57.14 - 64.42 | 72.67 | 74.18 | 71.56 - 77.51 |
| 2002 | 57.13 | 58.58 | 55.45 - 61.90 | 74.96 | 73.55 | 70.84 - 76.74 |
| 2003 | 55.88 | 57 | 53.81 - 60.67 | 73.53 | 72.96 | 70.14 - 75.98 |
| 2004 | 55.87 | 55.89 | 52.75 - 59.47 | 72 | 72.54 | 69.44 - 75.22 |
| 2005 | 56.88 | 55.23 | 52.22 - 58.29 | 74.13 | 72.4 | 69.44 - 75.22 |
| 2006 | 56.47 | 54.72 | 51.70 - 57.71 | 72.2 | 72.29 | 69.44 - 75.22 |
| 2007 | 53.88 | 54.03 | 51.19 - 57.14 | 73.3 | 71.95 | 68.75 - 75.22 |
| 2008 | 51.78 | 53.18 | 50.17 - 56.01 | 69.36 | 71.33 | 68.75 - 74.48 |
| 2009 | 50.38 | 52.34 | 49.67 - 54.90 | 68.55 | 70.62 | 68.07 - 73.00 |
| 2010 | 54.28 | 51.43 | 49.18 - 53.81 | 72.66 | 69.94 | 67.39 - 72.27 |
| 2011 | 53.14 | 50.45 | 48.21 - 52.75 | 71.74 | 69.3 | 66.72 - 71.56 |
| 2012 | 48.65 | 49.45 | 47.25 - 51.70 | 67.63 | 68.64 | 66.05 - 70.84 |
| 2013 | 47.27 | 48.42 | 46.32 - 50.17 | 64.54 | 67.96 | 66.05 - 70.14 |
| 2014 | 46.42 | 47.35 | 45.40 - 49.18 | 66.26 | 67.25 | 65.40 - 69.44 |
| 2015 | 47.23 | 46.25 | 44.50 - 48.21 | 68.02 | 66.54 | 64.10 - 68.75 |
| 2016 | 45.13 | 45.11 | 43.18 - 47.25 | 67.38 | 65.83 | 63.46 - 68.75 |
| 2017 | 43.84 | 43.96 | 41.49 - 46.78 | 64.43 | 65.1 | 62.21 - 68.07 |
| Source: NEM (CBS, Sovon) | ||||||
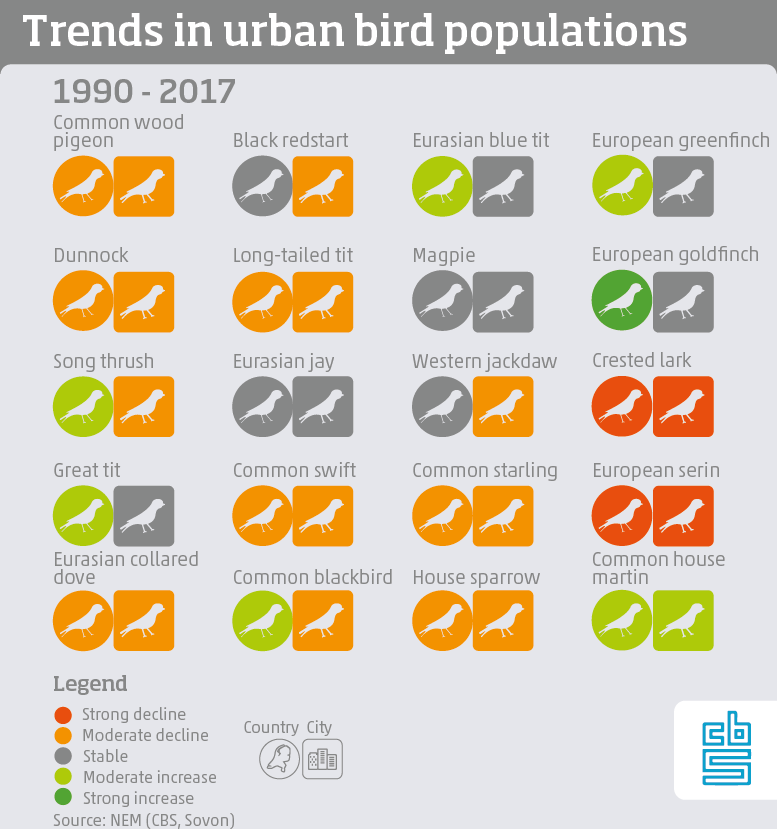
Only common house martin on the rise as urban bird
Many breeding birds depending on or commonly found in an urban environment are on the decline. This applies to 13 out of the 20 urban bird species, including the house sparrow, the western jackdaw, the common blackbird and the common starling. The crested lark has even fully disappeared from the city. In 2017, the European serin population was only 1 percent of the total population in 1990.
In urban areas, only the common house martin has increased in number since 1990. The increase follows a decrease of around 80 percent in the preceding decades. Populations of six species have been stable since 1990, namely the magpie, Eurasian jay, European greenfinch, great tit, Eurasian blue tit and European goldfinch.
On the other hand, magpie and western jackdaw populations have increased again in recent years. At the same time, however, the European greenfinch, great tit and long-tailed tit have seen a decline over the past ten years.
Nationwide increase for seven urban bird species
Outside of urban areas, some of these populations are still growing. Since 1990, seven species have increased in number nationwide, four have remained stable and nine are declining at the national level as well.
The population development of eight species is lower in urban areas than nationwide. This is the case for the European goldfinch, the song thrush and the European greenfinch, for example. The urbanwide development does not exceed the nationwide trend for any of the bird species. This indicates that the city has become a less suitable environment than the countryside for urban birds to breed in.