Well-being improving
Together, these 21 broad well-being trends (abbreviated as BWTs) provide an indication of current trends in well-being throughout the Netherlands. The benchmark indicators which are measured by these BWTs are based on international guidelines in combination with the availability of data. In selecting them, Statistics Netherlands (CBS) has attempted to strike a balance between completeness on the one hand and clarity and comprehensibility on the other. CBS reports this today at the launch of its first ‘Monitor of Well-being’.
At the request of the Dutch Cabinet, CBS will publish the Monitor of Well-Being on an annual basis as of 2018. Today, the Cabinet will also provide feedback on the main conclusions in this first edition of the Monitor. The Monitor of Well-being will be discussed by the House of Representatives during the upcoming annual Accountability Debate. On the basis of feedback from politicians and the public, the Monitor - including the set of indicators - will be developed further over the coming years.
At the same time today, the three policy assessment agencies - the Netherlands Bureau for Economic Policy Analysis (CPB), the Netherlands Environmental Assessment Agency (PBL) and the Netherlands Institute for Social Research (SCP) - are publishing the results of a joint study in the area of broad well-being.
Well-being here and now, in the future, and elsewhere
In accordance with international definitions, three dimensions are distinguished within the concept of broad well-being. The first dimension is that of quality of life as it currently exists in the Netherlands, i.e. well-being ‘here and now’. The second dimension pertains to the consequences of our present-day actions for future generations, i.e. ‘future’ well-being. The third and last dimension is international: the impact our current level of well-being has on other countries and on the world’s poorest countries in particular: well-being ‘elsewhere’.
Each of the three dimensions comprises a range of themes on which progress is assessed by means of one or more indicators. For each of these indicators, the trend, the latest developments and, where possible, the Netherlands’ position within the EU are determined. These Broad Well-being Trends (BWTs) have been defined for a period of eight years, up to and including the most recently available reporting year, mostly 2017. Where available, the latest developments also pertain to 2017.
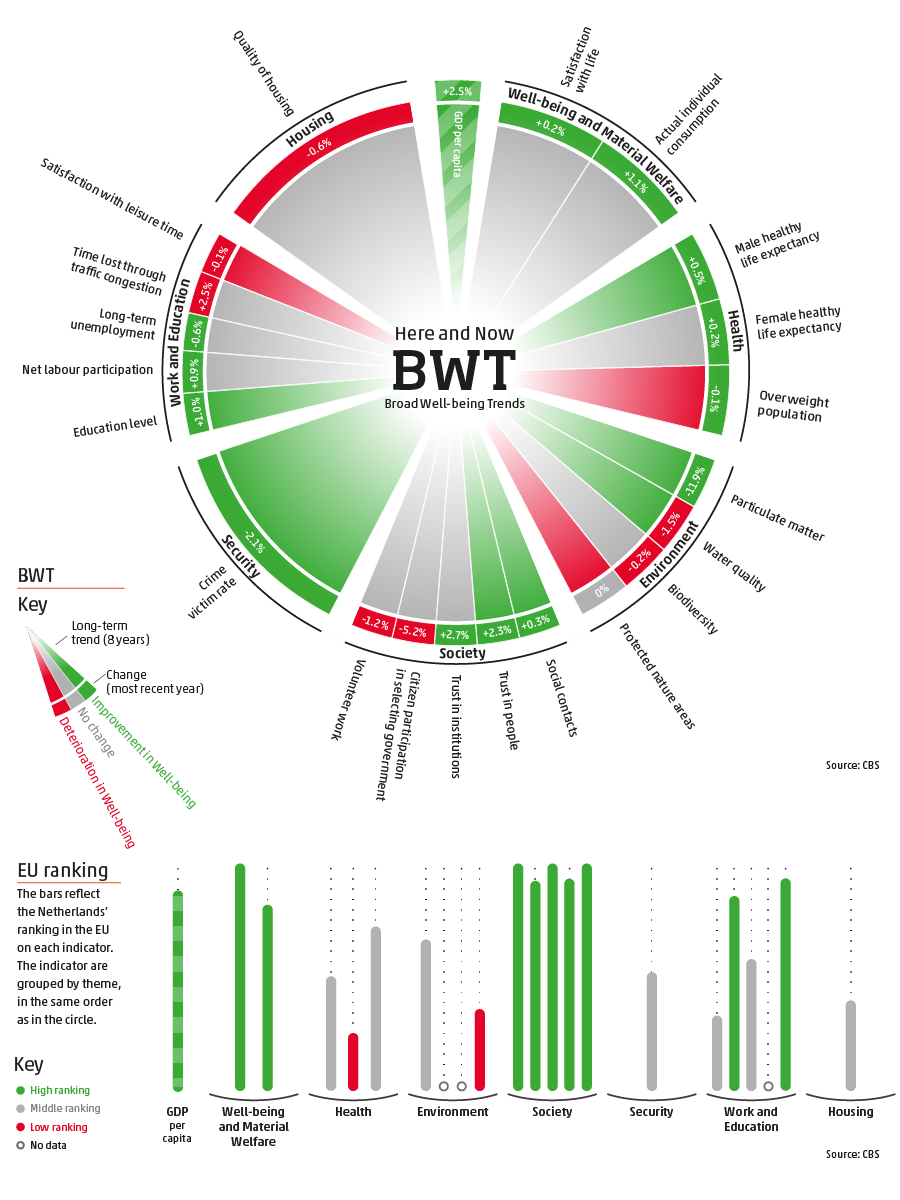
Most ‘here and now’ indicators moving upwards
The assessment of well-being ‘here and now’ is based on 21 indicators, divided over seven different themes. Over the past eight years, three of the ‘here and now’ BWTs have been negative. Seven have been positive; these include security, male healthy life expectancy and social trust. Most recently, however, there have been fewer positive trends; declines have occurred in the indicators for traffic congestion, housing quality, water quality, biodiversity, influence on public administration, volunteer work and satisfaction with the amount of free time.
Compared to other EU countries, well-being in the Netherlands is high in many areas, with the social domain (including such aspects as generalised trust and social contacts) achieving a particularly high score. The Netherlands only ranks relatively low in the EU in terms of the environment and female healthy life expectancy.
Broad Well-being Trends (BWTs) “Here and Now” visualised
The pie chart below visualises the trend-like development of all relevant indicators which together form an image of broad well-being in the “Here and Now” dimension, grouped into seven different themes.
Many aspects of natural capital showing downward trend
For the purpose of measuring the potential development of our future well-being, we distinguish four different types of capital. As these capitals increase, the level of well-being for future generations will rise, and vice versa. The four types of capital are economic, human, natural and social capital. Each of these is represented by three or more indicators.
Broad Well-being Trends (BWTs) “Later” visualised
The pie chart below visualises the trend-like development of all relevant indicators which together form an image of broad well-being in the “Later” dimension, grouped into four different themes. The GDP trend is included for reference. Below, the same indicators are displayed to compare the Netherlands with other countries in the EU.
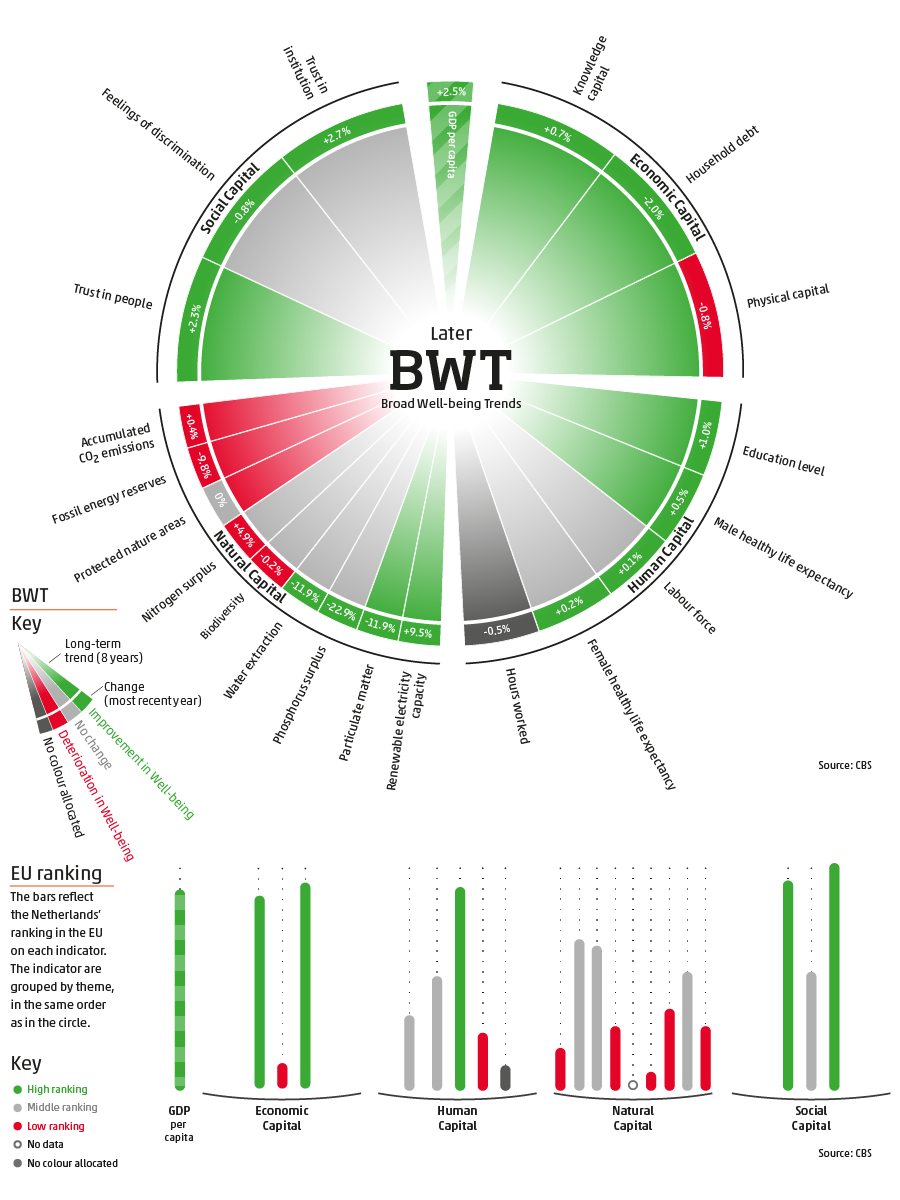
Out of the altogether 20 broad well-being trends for the future, eight are positive while three are negative. All three downward trends concern natural capital: the state of natural resources, nature and the environment. In addition, for natural capital five trends are neutral and only two are improving.
In the latest developments, five trends have deteriorated and four of these concern natural capital, while the Netherlands already has relatively low scores on natural capital in within the EU.
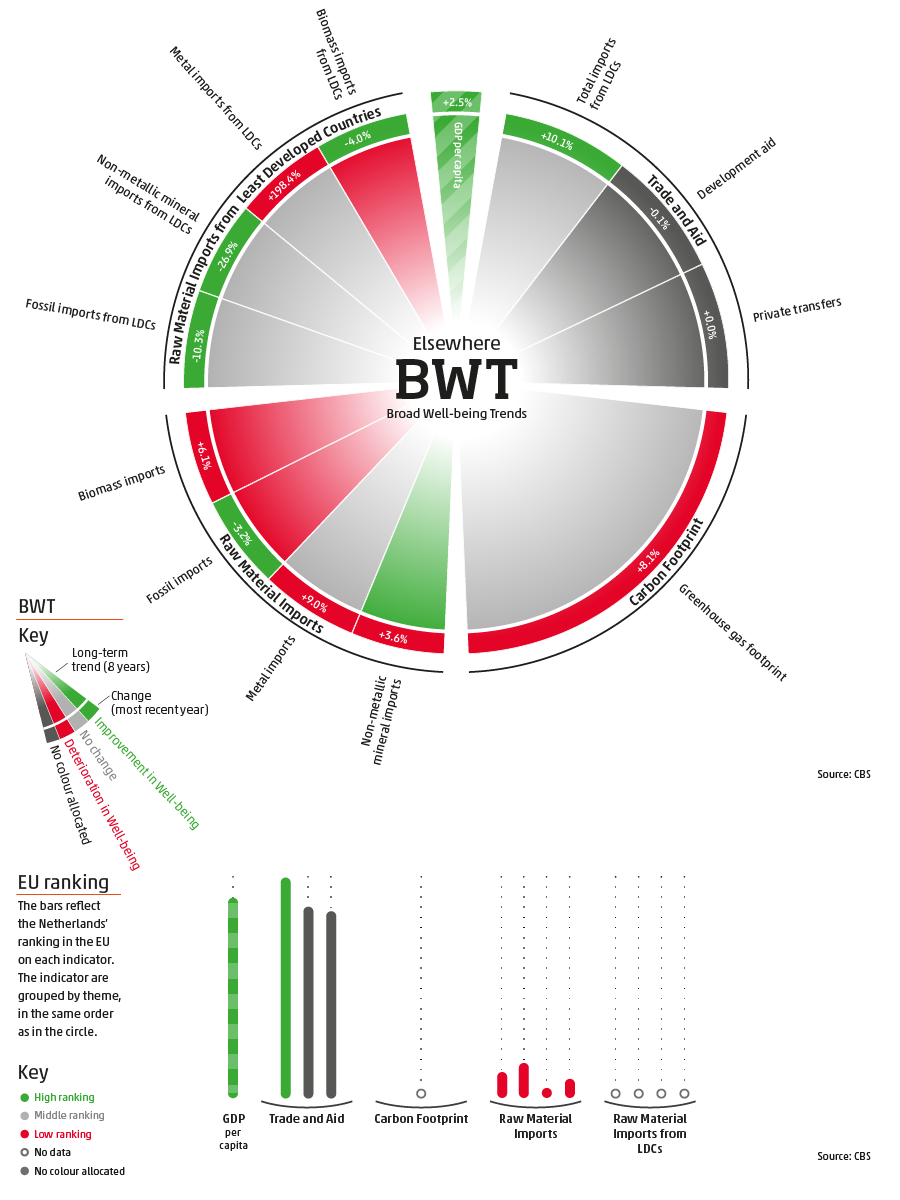
Many raw material imports
Well-being ‘elsewhere’ concerns welfare effects of our actions on the rest of the world. Four different domains are distinguished here: trade and aid, the greenhouse gas footprint, raw material imports in general, and raw material imports from the least developed countries (LDCs) in particular. In line with international agreements, raw material imports from other countries are considered because these signify extraction from the natural capital of these countries. Moreover, the LDCs are in a relatively weak position in terms of maximising their returns from this loss of natural capital. On the other hand, these countries do receive revenues as a result of our raw material imports, just as other countries do. This explains why total imports from LDCs under ‘trade and aid’ are marked as welfare enhancing.
Three out of the twelve BWTs for ‘elsewhere’ are downwards, indicating that we increasingly rely on imports of fossil fuels and biomass from the rest of the world and on biomass imports from the LDCs in particular. Only non-metallic minerals are to a lesser extent imported.
In the latest developments, five trends are upwards and five are downwards. The growth of imports from LDCs in particular appears to be slowing down, while that of imports from the rest of the world is picking up pace. The greenhouse gas footprint also increased in 2017, reversing the trend of the past few years. Compared to other EU countries, the Netherlands has a high level of interaction with LDCs in the form of trade and aid. It also imports relatively many raw materials.
Broad Well-being Trends (BWTs) “Elsewhere” visualised
The pie chart below visualises the trend-like development of all relevant indicators which together form an image of broad well-being in the “Elsewhere” dimension, grouped into four different themes. The GDP trend is included for reference. Below, the same indicators are displayed to compare the Netherlands with other countries in the EU.
Related items
- News release - Well-being not distributed equally
- News release - Dutch GHG footprint larger in 2017