More deaths among cyclists than car occupants in 2017
[video: https://www.cbs.nl/en-gb/video/523a1e2cdabd48ac915ee111f01097fb]
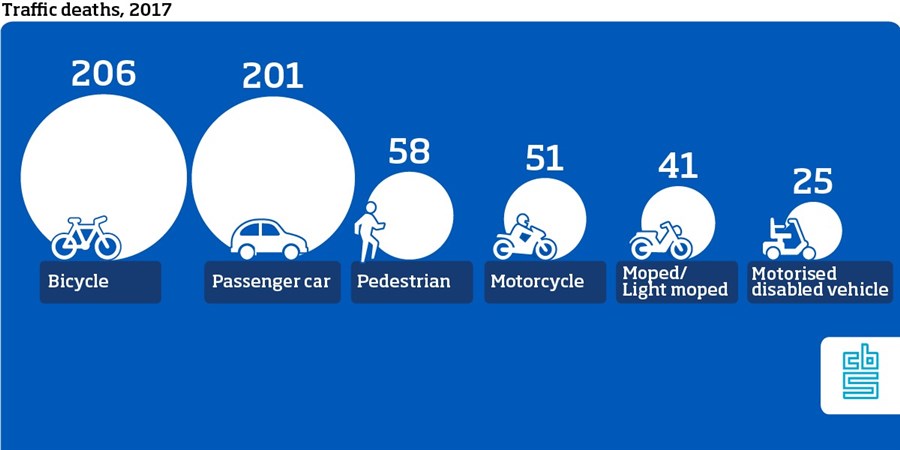
Last year, 206 cyclists were killed in traffic accidents, 17 more than in 2016 and the highest number in 10 years. In the same year, 201 passenger car occupants lost their lives on the road, down by 30 relative to 2016. For the first time, the death toll was higher among cyclists than car occupants. In addition, traffic deaths included 58 pedestrians, 51 motorcyclists, 41 moped and light-moped riders and 25 mobility scooter riders.
| Total | Car occupants | Cyclists | |
|---|---|---|---|
| 1996 | 1251 | 609 | 239 |
| 1997 | 1235 | 591 | 264 |
| 2000 | 1149 | 603 | 212 |
| 1999 | 1186 | 587 | 227 |
| 2000 | 1166 | 543 | 233 |
| 2001 | 1083 | 504 | 225 |
| 2002 | 1066 | 503 | 195 |
| 2003 | 1088 | 496 | 219 |
| 2004 | 881 | 420 | 180 |
| 2005 | 817 | 356 | 181 |
| 2006 | 811 | 340 | 216 |
| 2007 | 791 | 317 | 189 |
| 2008 | 750 | 317 | 181 |
| 2009 | 720 | 296 | 185 |
| 2010 | 640 | 246 | 162 |
| 2011 | 661 | 231 | 200 |
| 2012 | 650 | 232 | 200 |
| 2013 | 570 | 193 | 184 |
| 2014 | 570 | 187 | 185 |
| 2015 | 621 | 224 | 185 |
| 2016 | 629 | 231 | 189 |
| 2017 | 613 | 201 | 206 |
More men involved in fatal cycling accidents
The number of cycling casualties only increased among men. The number of male cyclist fatalities increased from 125 in 2016 to 148 in 2017. Among women, the number decreased slightly, from 64 in 2016 to 58 in 2017.
| cyclist fatalities (per 100,000 residents) | km cycled per person per day | |
|---|---|---|
| Under 12 yrs | 0.18 | 1.77 |
| 12-17 yrs | 0.24 | 6.37 |
| 18-24 yrs | 0.54 | 2.59 |
| 25-34 yrs | 0.28 | 2.03 |
| 35-49 yrs | 0.62 | 2.01 |
| 50-64 yrs | 0.76 | 2.52 |
| 65-74 yrs | 2.58 | 2.55 |
| 75 yrs and over | 6.74 | 1.35 |
Please note: the figure above shows traffic deaths among cyclists per 100 thousand inhabitants and the cycling distance per person per day.
Two out of three cyclist fatalities involved people aged 65 and up. When expressed as a proportion of population, this is still a relatively large share. This group travels the least by bicycle. Three percent of cyclist fatalities involved people under the age of 18. In all age groups, more men than women died in cycling accidents.
Number of bicycle deaths among men on e-bikes almost doubled
In 2017, 57 e-bike riders were killed. This is more than one-quarter of all cyclist deaths. The number of e-bike victims was up by 17 compared to 2016. This increase only occurred among men. The number of e-bike victims among men rose from 20 in 2016 to 38 in 2017. More than three-quarters were over the age of 65. Among this age group, the number of e-bike victims doubled, from 15 in 2016 to 31 in 2017.
Most fatal bicycle accidents per kilometre in Zeeland
In the province of Noord-Brabant, 35 people were killed in bicycle accidents in 2017, the highest number of all provinces. Gelderland also saw a high number of cycling deaths. Flevoland and Drenthe held the lowest shares in this respect, but a shorter distance was covered by bicycle. Zeeland and Overijssel have the highest shares of bicycle deaths per kilometre, while Drenthe and Groningen occupy the lowest shares.
| cyclist fatalities | distance per bn km cycled | |
|---|---|---|
| Noord-Brabant | 35 | 2.2 |
| Gelderland | 33 | 1.9 |
| Zuid-Holland | 28 | 2.8 |
| Noord-Holland | 26 | 2.6 |
| Overijssel | 25 | 1.1 |
| Utrecht | 25 | 1.2 |
| Limburg | 11 | 0.7 |
| Friesland | 8 | 0.5 |
| Zeeland | 8 | 0.3 |
| Groningen | 3 | 0.5 |
| Drenthe | 2 | 0.5 |
| Flevoland | 2 | 0.2 |
Reduction in traffic deaths among young and old drivers
In 2017, 201 passenger car occupants died in traffic accidents. This is down by 30 compared to 2016. The number of traffic deaths among car drivers decreased from 186 in 2016 to 163 in 2017 and the number of deaths among car passengers decreased from 45 in 2016 to 38 in 2017. The share of fatalities among young people (aged between 18 and 24) and elderly people (aged 65 and up) in 2017 was reduced compared to 2016. However, the share of victims aged between 25 and 34 increased.
| 2016 | 2017 | |
|---|---|---|
| 75 years or older | 29 | 23 |
| 65 to 74 years | 23 | 10 |
| 50 to 64 years | 39 | 39 |
| 35 to 49 years | 32 | 28 |
| 25 to 34 years | 28 | 37 |
| 18 to 24 years | 35 | 26 |
Rise in traffic deaths in Zuid-Holland
Noord-Brabant recorded the highest number of traffic deaths: 98. However, Zuid-Holland showed the largest increase in the number of traffic deaths. In 2017, 97 people were killed in this province, compared to 70 in 2016. Groningen and Overijssel also saw an increase in traffic fatalities relative to 2016. Flevoland, Drenthe and Zeeland recorded the lowest number of traffic deaths.
| 2016 | 2017 | |
|---|---|---|
| Noord-Brabant | 113 | 98 |
| Zuid-Holland | 70 | 97 |
| Gelderland | 98 | 83 |
| Noord-Holland | 86 | 81 |
| Overijssel | 59 | 65 |
| Limburg | 49 | 46 |
| Utrecht | 44 | 40 |
| Friesland | 33 | 26 |
| Groningen | 15 | 25 |
| Drenthe | 29 | 20 |
| Zeeland | 22 | 22 |
| Flevoland | 11 | 10 |