Employment up again

The other people without work, nearly 3.9 million, had not been looking for work and/or were not available recently. Their number increased by an average of 3 thousand per month. The Employee Insurance Agency (UWV) reported a further decrease in unemployment (WW) benefits to a total of 343 thousand in October.
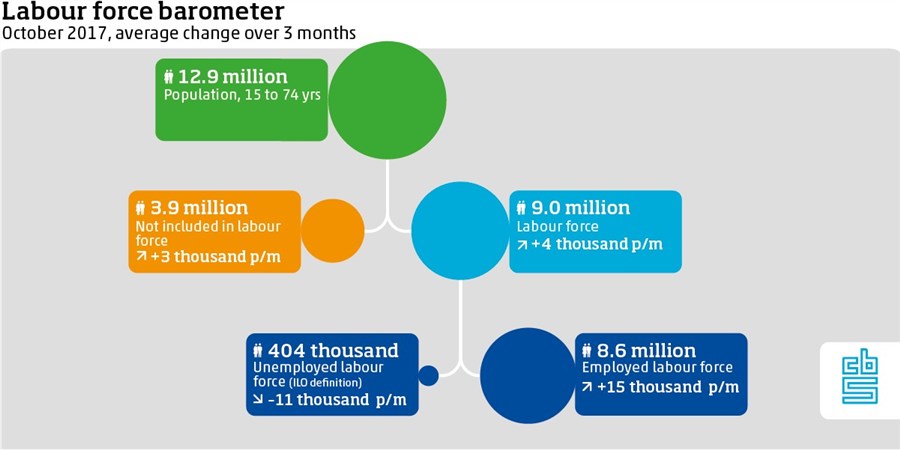
Unemployment indicator (ILO definition) drops to 4.5 percent
To be able to compare cyclical developments in the labour market between countries, the unemployment indicator of the International Labour Organization (ILO) is often taken as a measure. According to ILO’s definition, the group of unemployed people includes all 15 to 74-year-olds who are without paid work but are actively looking and are immediately available. As indicated above, this number stood at 404 thousand in October, i.e. 4.5 percent of the labour force. In September, this was as much as 4.7 percent.
This figure does not include all people without work who would like to work. People who do want to work but who have not sought work recently for any particular reason, and/or have not been immediately available, do not count towards ILO’s unemployment definition. Likewise, part-timers who want to work more hours are not included. CBS describes these groups on a quarterly basis. Furthermore, the number of hours worked by people in paid employment is reported quarterly. The monthly figures on people in paid employment (the active labour force) include all people in work, regardless of the number of hours worked.
UWV: Number of WW benefits continues to drop
In October, the number of current unemployment (WW) benefits fell by nearly 8 thousand. The total number of WW benefits at the end of October stood at 343 thousand, the lowest level since December 2012. A decline was seen particularly among people working in construction and in education. In agriculture, however, there was an increase in WW benefits of 7.8 percent in October relative to September. Seasonal effects play a role in the month-on-month changes: in October, there was less employment in agriculture and more in education.
When comparing to one year ago, October 2016, the number of WW benefits fell by 18.2 percent. The decline is most significant in the construction sector (- 41.9 percent) and among temp agencies (- 28.5 percent).
Youth unemployment below pre-crisis level
With the unemployment rate standing at 4.5 percent, the difference with the pre-crisis level has been reduced to less than 1 percentage point. Exactly nine years ago, at the end of 2008, unemployment was at its lowest level, i.e. 3.6 percent of the labour force. Youth unemployment, on the other hand, reached a lower level than before the crisis for the first time: 7.9 percent in October. Just before the crisis, the lowest level was 8.4 percent.
| 15 to 24 yrs | 25 to 44 yrs | 45 to 74 yrs | |
|---|---|---|---|
| '03 | 9.1 | 3.4 | 3.1 |
| 9.2 | 3.5 | 3.2 | |
| 9.2 | 3.7 | 3.4 | |
| 9.5 | 3.8 | 3.4 | |
| 10 | 3.8 | 3.5 | |
| 10.2 | 3.9 | 3.5 | |
| 10.3 | 4 | 3.6 | |
| 10.2 | 4.1 | 3.7 | |
| 10.3 | 4.2 | 3.8 | |
| 10 | 4.4 | 4 | |
| 10.2 | 4.4 | 4.2 | |
| 10.5 | 4.6 | 4.1 | |
| '04 | 10.5 | 4.7 | 4.1 |
| 10.8 | 4.6 | 4.2 | |
| 11.2 | 4.6 | 4.2 | |
| 11.6 | 4.7 | 4.4 | |
| 11.6 | 4.8 | 4.5 | |
| 11.6 | 4.8 | 4.5 | |
| 11.6 | 4.6 | 4.5 | |
| 11.4 | 4.6 | 4.5 | |
| 11.5 | 4.6 | 4.6 | |
| 11.9 | 4.7 | 4.5 | |
| 11.6 | 4.7 | 4.5 | |
| 11.8 | 4.9 | 4.7 | |
| '05 | 11.7 | 5 | 4.6 |
| 12.2 | 5.1 | 4.6 | |
| 12.1 | 5.1 | 4.6 | |
| 12.1 | 5 | 4.6 | |
| 12.3 | 5 | 4.6 | |
| 12 | 4.9 | 4.6 | |
| 11.9 | 4.9 | 4.7 | |
| 11.9 | 4.8 | 4.6 | |
| 11.9 | 4.7 | 4.7 | |
| 11.7 | 4.7 | 4.7 | |
| 11.5 | 4.7 | 4.7 | |
| 11.3 | 4.6 | 4.8 | |
| '06 | 11.1 | 4.3 | 4.7 |
| 11.2 | 4.2 | 4.7 | |
| 10.6 | 4.1 | 4.7 | |
| 10.1 | 4 | 4.6 | |
| 10 | 4.1 | 4.5 | |
| 9.7 | 3.8 | 4.5 | |
| 9.6 | 3.7 | 4.6 | |
| 9.6 | 3.5 | 4.5 | |
| 9.7 | 3.5 | 4.4 | |
| 9.5 | 3.5 | 4.4 | |
| 9.4 | 3.5 | 4.3 | |
| 9.5 | 3.4 | 4.1 | |
| '07 | 9.5 | 3.3 | 4 |
| 9.7 | 3.1 | 4 | |
| 9.4 | 3 | 3.8 | |
| 9.2 | 2.8 | 3.8 | |
| 9.4 | 2.8 | 3.7 | |
| 9.6 | 2.7 | 3.5 | |
| 10 | 2.7 | 3.6 | |
| 9.7 | 2.7 | 3.3 | |
| 9.3 | 2.8 | 3.4 | |
| 9.1 | 2.8 | 3.4 | |
| 9 | 2.7 | 3.4 | |
| 8.7 | 2.6 | 3.4 | |
| '08 | 8.6 | 2.6 | 3.4 |
| 8.5 | 2.4 | 3.2 | |
| 8.4 | 2.3 | 3.2 | |
| 8.7 | 2.2 | 3.3 | |
| 8.8 | 2.3 | 3.2 | |
| 8.7 | 2.4 | 3.2 | |
| 8.5 | 2.4 | 3 | |
| 8.4 | 2.3 | 3.1 | |
| 8.6 | 2.4 | 3.1 | |
| 8.4 | 2.4 | 3.1 | |
| 8.5 | 2.5 | 2.9 | |
| 8.7 | 2.6 | 2.9 | |
| '09 | 8.8 | 2.6 | 2.9 |
| 9 | 2.7 | 3 | |
| 9.4 | 2.6 | 3.1 | |
| 9.7 | 3 | 3.1 | |
| 10 | 3.1 | 3 | |
| 10.1 | 3.2 | 3.2 | |
| 10.5 | 3.4 | 3.2 | |
| 10.5 | 3.5 | 3.3 | |
| 10.8 | 3.6 | 3.4 | |
| 11 | 3.6 | 3.4 | |
| 11.3 | 3.8 | 3.5 | |
| 11.3 | 3.9 | 3.7 | |
| '10 | 11.5 | 4 | 3.8 |
| 11.3 | 4 | 3.8 | |
| 11.3 | 3.9 | 3.9 | |
| 11.2 | 3.8 | 3.8 | |
| 11.2 | 3.8 | 3.8 | |
| 11.1 | 3.8 | 3.9 | |
| 11 | 3.9 | 4 | |
| 11.1 | 3.7 | 4 | |
| 11 | 3.8 | 3.9 | |
| 10.9 | 3.7 | 3.9 | |
| 10.8 | 3.7 | 4 | |
| 10.8 | 3.7 | 4.1 | |
| '11 | 10.5 | 3.7 | 4.2 |
| 9.9 | 3.7 | 4.2 | |
| 9.4 | 3.6 | 4.3 | |
| 9.3 | 3.6 | 4.2 | |
| 9.2 | 3.6 | 4.3 | |
| 9.5 | 3.6 | 4.1 | |
| 9.9 | 3.7 | 4.2 | |
| 9.8 | 3.9 | 4.1 | |
| 10.2 | 4 | 4.1 | |
| 10.3 | 4.3 | 4.3 | |
| 10.7 | 4.4 | 4.4 | |
| 10.8 | 4.3 | 4.3 | |
| '12 | 11.2 | 4.5 | 4.4 |
| 11.7 | 4.2 | 4.4 | |
| 11.6 | 4.4 | 4.4 | |
| 11.6 | 4.6 | 4.6 | |
| 11.3 | 4.6 | 4.6 | |
| 11.5 | 4.7 | 4.5 | |
| 11.5 | 5 | 4.6 | |
| 11.6 | 4.8 | 4.6 | |
| 12.1 | 4.9 | 4.7 | |
| 12.1 | 5 | 4.8 | |
| 12 | 5.2 | 5 | |
| 12.3 | 5.4 | 5.2 | |
| '13 | 12.5 | 5.7 | 5.3 |
| 12.5 | 5.8 | 5.5 | |
| 12.6 | 6 | 5.7 | |
| 12.7 | 6.1 | 5.8 | |
| 12.6 | 6.2 | 5.9 | |
| 13 | 6.3 | 6 | |
| 13.6 | 6.5 | 6.1 | |
| 13.5 | 6.6 | 6.2 | |
| 13.9 | 6.6 | 6.2 | |
| 13.8 | 6.6 | 6.3 | |
| 13.8 | 6.5 | 6.3 | |
| 13.7 | 6.7 | 6.5 | |
| '14 | 13.5 | 6.8 | 6.6 |
| 13.8 | 6.9 | 6.6 | |
| 13.6 | 6.8 | 6.7 | |
| 13.2 | 6.7 | 6.8 | |
| 13 | 6.5 | 6.7 | |
| 12.8 | 6.3 | 6.6 | |
| 12.8 | 6.1 | 6.6 | |
| 12.4 | 6 | 6.5 | |
| 12 | 5.9 | 6.5 | |
| 12 | 6 | 6.5 | |
| 11.9 | 6 | 6.5 | |
| 11.8 | 6 | 6.7 | |
| '15 | 11.7 | 6.1 | 6.7 |
| 11 | 6.1 | 6.7 | |
| 10.8 | 5.9 | 6.7 | |
| 10.9 | 5.9 | 6.6 | |
| 11.1 | 5.7 | 6.5 | |
| 11.1 | 5.5 | 6.6 | |
| 11.3 | 5.4 | 6.4 | |
| 11.2 | 5.4 | 6.4 | |
| 11.5 | 5.4 | 6.5 | |
| 11.6 | 5.4 | 6.6 | |
| 11.2 | 5.2 | 6.5 | |
| 11.2 | 5.1 | 6.4 | |
| '16 | 11.2 | 4.9 | 6.2 |
| 11.3 | 5 | 6.2 | |
| 11.4 | 4.9 | 6.1 | |
| 11.2 | 4.8 | 6.1 | |
| 11.1 | 4.6 | 6 | |
| 10.8 | 4.7 | 5.9 | |
| 10.8 | 4.7 | 5.6 | |
| 10.6 | 4.5 | 5.3 | |
| 10.5 | 4.5 | 5.1 | |
| 10.5 | 4.3 | 5.1 | |
| 10.3 | 4.3 | 5.1 | |
| 10.2 | 4.1 | 4.9 | |
| '17 | 9.8 | 4.1 | 4.8 |
| 9.7 | 4 | 4.9 | |
| 9.6 | 3.8 | 4.8 | |
| 9.5 | 3.7 | 4.7 | |
| 9 | 3.9 | 4.8 | |
| 8.9 | 3.7 | 4.7 | |
| 8.8 | 3.8 | 4.4 | |
| 8.9 | 3.7 | 4.1 | |
| 8.5 | 3.7 | 4.2 | |
| 7.9 | 3.5 | 4.1 |
Every month, CBS publishes figures on the total (employed and unemployed) labour force as well as the number of people not in the labour force (ILO definition). However, this does not include the total unused labour potential, i.e. other groups of people aside from the unemployed according to the ILO indicator. CBS publishes quarterly on the size and composition of these groups. Therefore, the overall picture provided below is based on the latest quarterly figures (Q3 2017). Development of the total unused labour potential closely follows developments in unemployment according to the ILO definition.
8.6 million people employed in Q3
Of the 12.9 million people aged 15 to 74, over 8.6 million people were in paid employment and 408 thousand were unemployed (ILO standard; not seasonally adjusted) in Q3. These included 153 thousand people who had been seeking work for at least twelve months. Almost two in three were aged 45 years or older. The groups of employed and unemployed combined represent the Dutch labour force.
The other part, over 3.8 million, is not included. The majority of the latter group were not willing or not able to work (3.2 million), e.g. due to education or training, care for others, sickness or old age. In addition, there were 210 thousand people who were willing to work in Q3, but who were not looking and not immediately available for work; for example, people who were in education or training. Furthermore, there were people either looking (162 thousand) or immediately available for work (263 thousand).
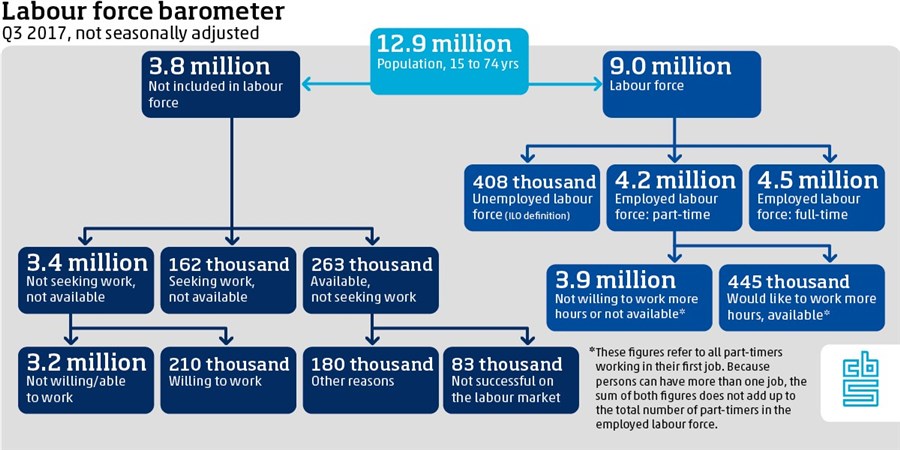
Part-time workers
Unused labour potential does not only comprise people without work. Among the 4.2 million people working part-time, 445 thousand were seeking more working hours in Q3, for which they were also immediately available.
Explanation
Every month, CBS publishes figures on the labour force in accordance with international guidelines. The corresponding indicators, i.e. the employed and unemployed labour force, are used around the world to describe cyclical developments on the labour market. Monthly figures are essential in this respect. In addition, UWV issues its own monthly figures on unemployment benefits; however, these do not correspond with the indicators on the labour force.
Sources
Related items
- Video - Unemployment
- Dossier - Business cycle