Households spend more on repairs and second-hand goods
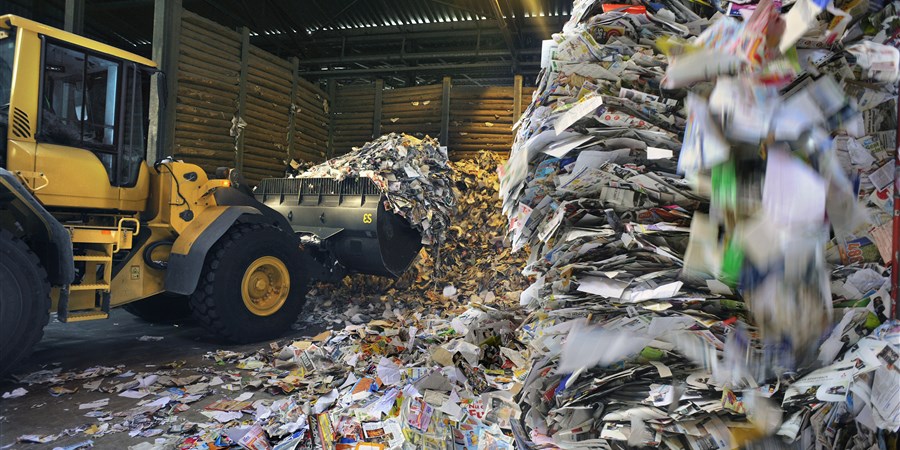
In some areas, the Netherlands has already realised circular economy solutions. In most sectors of industry, for example, recyclable materials are used in the production process. Relative to 1996, Dutch households also spent 52 percent more in 2014 on repairs (cars and other goods) and thrift shops have doubled their turnover during the past decade. The amount of waste per kg of manufactured product has also diminished between 2008 and 2014. Compared to other European countries, a lot of waste (80 percent) is being recycled in the Netherlands, but this percentage has not grown since 2000.
Household spending on repairs
Household spending on repairs
Series 0
1996
2.9
1997
3.1
1998
3.1
1999
3.3
2000
3.4
2001
3.6
2002
3.8
2003
3.8
2004
3.9
2005
3.8
2006
3.9
2007
3.9
2008
4
2009
4.2
2010
4.3
2011
4.4
2012
4.2
2013
4.2
2014
4.4
Household spending on repairs
Series 0
1996
2.9
1997
3.1
1998
3.1
1999
3.3
2000
3.4
2001
3.6
2002
3.8
2003
3.8
2004
3.9
2005
3.8
2006
3.9
2007
3.9
2008
4
2009
4.2
2010
4.3
2011
4.4
2012
4.2
2013
4.2
2014
4.4
38 percent of food wasted in the Netherlands
In other areas, however, the Dutch economy is still not very circular. The amount of household belongings is increasing and the manufacture requires more raw materials. A lot of food is thrown away in the Netherlands - more than 2.5 kg per capita each week - 38 percent of all food is wasted: avoidable loss of food still fit for consumption. Additionally, the chemical industry still heavily depends on fossil raw materials instead of biomass. With respect to the use of raw materials, most production processes have not gained in efficiency between 2008 and 2014.