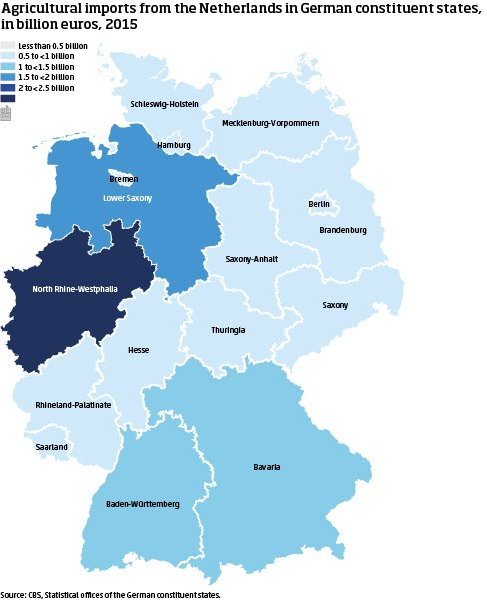
Although agricultural imports from the Netherlands rose in most constituent states, the Dutch share in imports only grew in the economically smaller constituent states: Saarland (from 12.7 to 19.2 percent, an increase of 6.5 percentage points), Saxony-Anhalt (5.1 percentage points), Brandenburg (4.5 percentage points), Thuringia (3.1 percentage points), Hamburg (1.6 percentage points) and Rhineland-Palatinate (0.2 percentage point). In the economically larger federal states of Bavaria, North Rhine-Westphalia, Baden-Württemberg and Hesse, Dutch agricultural products are losing or at least not gaining market share.
Imported Dutch agricultural goods to German constituent states
Imported Dutch agricultural goods to German constituent states
2010
2015
North-Rhine Westphalia
33.06
30.86
Saxony-Anhalt
21.51
26.57
Lower Saxony
27.53
25.97
Thuringia
20.79
23.91
Brandenburg
14.85
19.44
Saarland
12.69
19.2
Baden-Württemberg
18.94
18.63
Saxony
19.08
17.82
Hesse
18.93
17.74
Berlin
18.52
17.28
Bavaria
13.67
13.43
Schleswig-Holstein
15.18
10.61
Rhineland-Palatinate
9.73
9.92
Mecklenburg-Vorpommern
12.57
8.5
Bremen
9.2
8.03
Hamburg
6.21
7.76
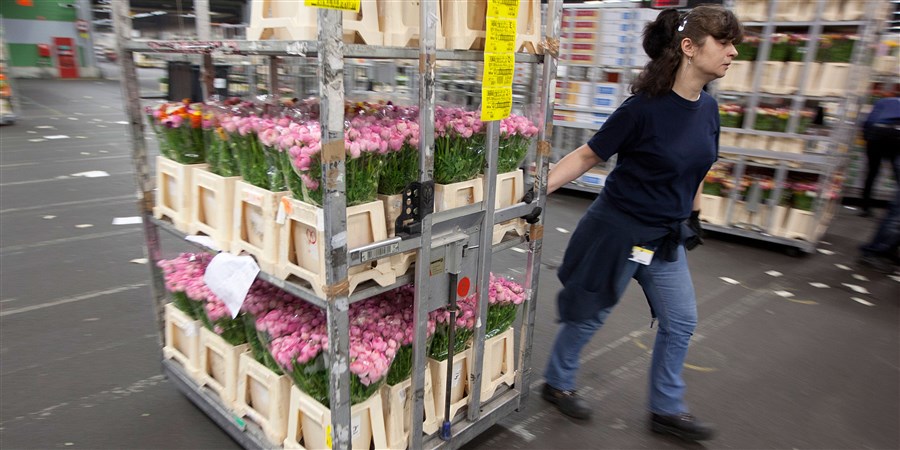
Flowers and plants major export products
The number one import products from the Netherlands to Germany are flowers and plants (2 bn euros). In second place are vegetables (1.7 bn euros), followed by cheese (0.9 bn euros), cattle feed (0.9 bn euros) and live animals (0.8 bn euros).
Flowers and plants are not only the largest product group, but the strongest growth was from this group as well: +265 million euros. This is closely followed by vegetables (+ 258 million) and fruit (+ 214 million). Imports of processed foods such as baby milkpowder and ketchup (+ 137 million) and cheese (+ 135 million) also grew significantly.
Top 10 imported agricultural products to Germany (billion euros, 2015)
Top 10 imported agricultural products to Germany (billion euros, 2015)
Series 0
Series 1
Flowers and plants
2
Vegetables; frozen, fresh, chilled
1.7
Cheese
0.94
Cattle feed
0.92
Live animals
0.82
Meat; dried, smoked or salted
0.66
Cocoa and cocoa butter
0.65
Unrefined vegetable oils and fats
0.51
Eggs
0.49
Beef
0.46
Germans import mostly Dutch eggs and flowers
The Dutch share in German imports is largest in the product groups eggs (71 percent), flowers and plants (60 percent), live animals (58 percent), margarine (53 percent) and prepared oils and fats (48 percent).