One quarter of primary and special needs schools invest capital

One quarter of primary and special needs schools invested a total of nearly 0.5 billion euro in 2006. Most of this capital was invested in bonds. These investments account for only a small share of schools’ assets, however.
Schools invest mainly in bonds
In 2006, 406 of the 1,626 boards of governors of primary schools invested capital. The value of these investments rose by 71 million euro in that year, to a total of nearly 0.5 billion euro. Primary and special needs schools invest mainly in bonds. Shares account for only a small part of investments. The extent to which schools invest their capital varies strongly: some 40 boards of governors account for about half of the invested money.
Investment by primary and special needs schools, 2006

Bank and savings balances account for most invested capital
The invested capital accounts for about 12 percent of the total assets of primary schools. Most of the assets of these schools consists of bank and savings balances, worth a total of more than 1.8 billion euro. Unlike schools in other sectors of education, primary schools own hardly any buildings or land, as the municipalities are responsible for these. They do own moveable goods such as furniture, teaching materials and computers; they must therefore maintain a reserve to replace these.
Assets of primary and special needs schools, 2006

Surplus on operating account
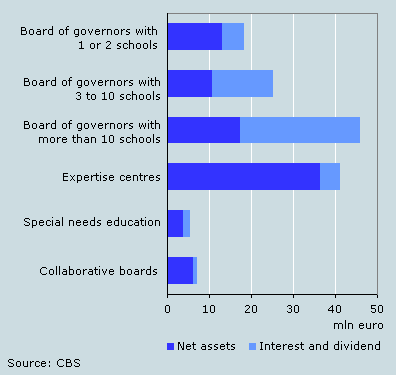
Primary and special needs schools realised a 144 million euro operating surplus in 2006. This is the equivalent of an average 87 euro per pupil. Independent expertise centres in particular realised a surplus on their operating accounts. These schools received extra government funds in 2006 as a result of the increase in the number of pupils, while they were probably not yet in a position to spend all of this money.
The returns on bank and savings balances and investment (among other things interest and dividend) contributed 40 percent to the balance. For boards of governors responsible for more than 10 schools in particular, the share of interest and dividend was large. By no means all schools were in a financially sound position in 2006; more than a quarter did not have enough money.
Operating results of primary and special needs schools, 2006

Broos Brouwers