Biodiversity monitored extensively by CBS
Half a century of nature statistics
CBS’ nature statistics have existed for half a century already. The work was initially aimed at mapping the distribution of species from a few species groups. Later, population trends could be calculated with the help of standardised observations. Such trends and the resulting indicators are widely used these days, for example to account for nature policies at the Ministry of Agriculture, Nature and Food Quality and in provinces. They are also being used for policy studies by the Netherlands Environmental Assessment Agency (PBL) or as a factual basis for World Wildlife Fund publications. Nevertheless, within CBS, the statistic had a separate status for a long time. CBS statistical researcher Richard Verweij explains: ‘That is now changing. There is an ever-widening focus on biodiversity and our data are needed in more and more places within the organisation. For example, we now work intensively with the Environmental Accounts Department.'International agreements
In the new Multi-annual Programme 2024-2028, much focus is put on climate and sustainability. Both economic activity and biodiversity play a major role in this regard. External demand for data is increasing as well, due to the wide interest in the realm of politics and policymaking, both nationally and Europe-wide, but also globally. The Ministry of Finance is at the helm of an interdepartmental policy research programme on biodiversity, for instance. As Patrick Bogaart, a statistical researcher in the Environmental Accounts department at CBS, explains: ‘At the insistence of our Director General, CBS participates in this research. Moreover, new international agreements on targets in this area were reached at the United Nations (UN) Biodiversity Conference in Canada late last year: the Convention on Biological Diversity (CBD). Through the European Union, this is also creating obligations for the Netherlands. Monitoring will be necessary for effective policymaking and to comply with new legislation, which is where CBS comes in.’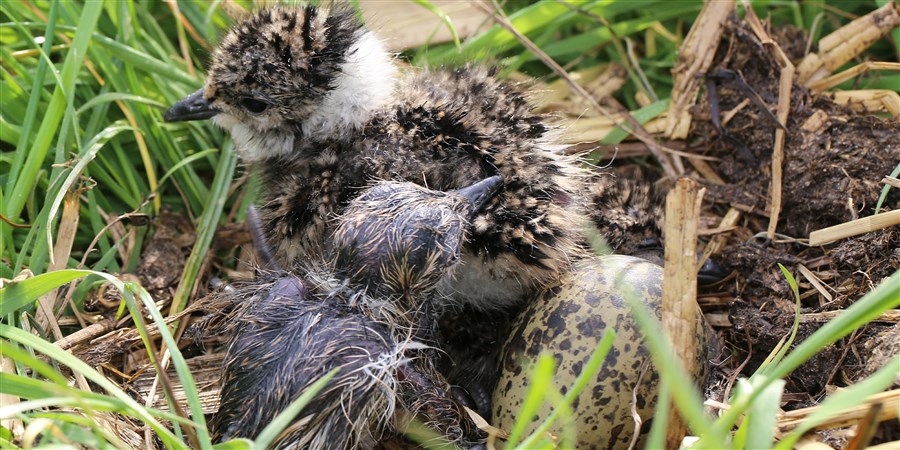
Monitoring at national level
To map biodiversity in the Netherlands, CBS uses data from the so-called Network Ecological Monitoring (NEM). Most of today’s flora and fauna monitoring programmes were set up in the 1990s and were later united in the NEM. Volunteers have been performing observations in a standardised manner ever since. The fieldwork is being coordinated by non-governmental organisations such as SOVON and Dutch Butterfly Conservation. CBS safeguards the quality of the monitoring networks and the resulting data.Provincial authorities and Natura 2000 areas
In the Netherlands, biodiversity-related work is being done at many different administrative levels. The provinces implement the policies and are mainly focused on the Natura 2000 areas. ‘Provinces must report to central government on the state of local nature. For this, they often make use of CBS regional data, for example on the butterfly, dragonfly and mammal populations. However, present-day nature monitoring was designed to form a nationwide picture. Currently, for many species, we do not have enough monitoring points to calculate reliable trends at provincial level, let alone at Natura 2000 level; that is why even more monitoring will be needed,’ Verweij explains. This need for local or regional data fits in with a broader trend. ‘Many societal challenges like eutrophication due to excessive nitrogen deposition and housing shortage are very complex,’ says Bogaart. ‘There are many aspects to it, and data on all these aspects are needed at local and regional level in order to answer the questions related to those challenges.’Research at the interface of nature, environment and economy
For its ecosystem accounts, CBS itself also needs additional data on biodiversity. After all, biodiversity is an important indicator for the quality of ecosystems and partly determines the ecosystem services that can be provided. Take for example the ecosystem service of nature recreation, where dune areas provide a significant value; but with too many hikers and cyclists in an area, nature can get disturbed and lose quality, so the use compromises sustainability. Bogaart says: ‘For even better monitoring of that balance, our departments are going to work together even more closely and conduct more research at the interface between nature, environment and natural capital. We are seeking answers to questions such as: which biodiversity data can be used for environmental accounts, or which economic factors have a negative impact on biodiversity and why? Verweij says: 'By working together more closely, we’ll be able to use our own CBS data more often in order to explain why, for example, a species is declining.'Experimenting
Ultimately, the objective is always to arrive at indicators that can directly support policy-making. Bogaart says: ‘For example, we’re now experimenting with landscape structure maps that include how many hedgerows and other small landscape elements there are in an area. These are a prerequisite for certain animals found in the area. We also compiled a grazing intensity map. This sort of information is highly relevant, for example in policymaking on protection of the godwit.’How is nature doing?
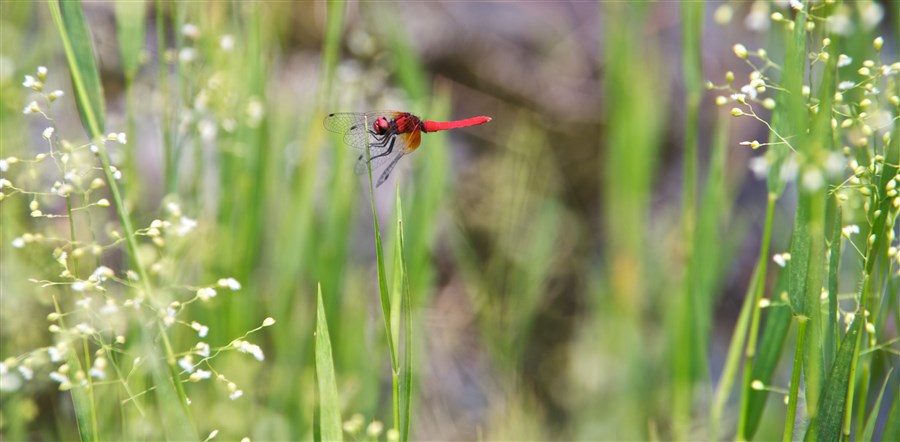
All nature statistics compiled by CBS are published onto the Environmental Data Compendium, a website about the state of the environment, nature, landscape and spatial developments in the Netherlands. The Compendium is a collaboration between CBS, the Netherlands Environmental Assessment Agency (PBL), Wageningen University and Research (WUR) and the National Institute for Public Health and the Environment (RIVM). It offers users explanations and interpretations of the data on display, which is needed to justify how the data are processed and how the results should be interpreted. Says Verweij: 'The answer to the question how nature is doing is complicated. There are quite a few negative developments, but there are also bright spots. Take dragonflies, for example. They’ve been doing better since the quality of freshwater in the Netherlands was improved. In addition, southern species are advancing further north due to climate change, which increases the counts. On the other hand, things are going badly for farmland birds due to developments in the agricultural area over the past few decades. That is why it’s so difficult to make a statement about nature.'Clear and complete picture
CBS’ biodiversity data are used, inter alia, for the Birds and Habitats Directives. These are two European directives aimed at nature protection. However, CBS itself does not comment on the significance of developments. Says Verweij: 'We present the figures as factually as possible. But because interpretation is so tricky, it carries the danger of people searching the data according to their own preferences. So we are studying ways of presenting the picture that emerges from our data as clearly and completely as possible.'Related items
- Article - Decline in farmland flora and fauna as of 1900
- Article - Understanding 100 years of farmland biodiversity loss
- CBS privacy regulations - Privacy
- Website - CLO - Environmental Data Compendium
- Website - UN - Convention on Biological Diversity