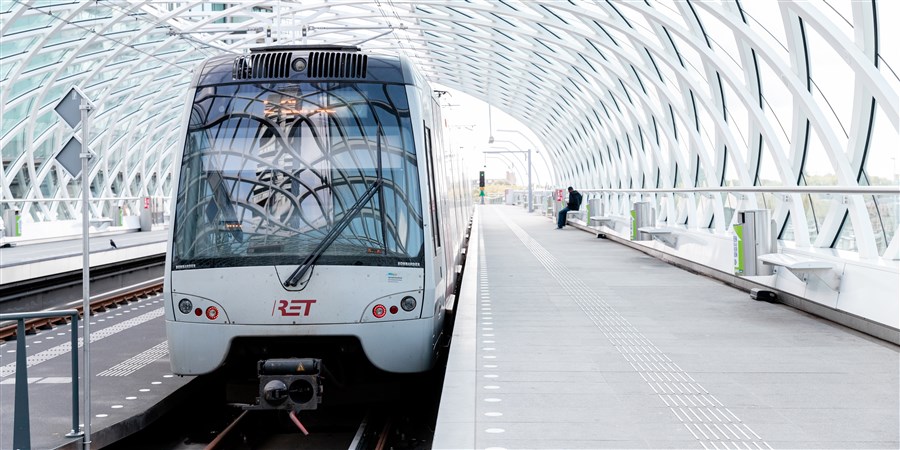
A model for crowded tubes in Rotterdam
Big data
This challenge represents one of the assignments on the Big Data course curriculum that is offered by Erasmus University. Gootzen, Guido de Jongh of RET, and Saskia Pothuis and Nathalie van Helvoort of the municipality of Rotterdam joined forces on this challenge. They were keen to see whether big data could be used to estimate the level of crowdedness on the RET’s E line tube. Gootzen explains: ‘We relied on data from CBS to obtain information about the number of journeys made in the Netherlands, data from RET to obtain information about the number of people travelling from A to B, and data from the municipality to obtain information about the local population growth per district. We then used a CBS model to combine these various data sources.’
Testing the model
Nathalie van Helvoort had this to say: ‘We tried to ensure that our research question was very broad, as we were taught to think big and then narrow it down. This is why we looked at transport flows between The Hague and Rotterdam, and included road vehicles and trains in our analysis. We then developed a model to portray transport flows on the E line.’ The CBS model had already been developed prior to the start of this challenge. Gootzen explains: ‘This challenge presented us with the perfect opportunity to test the model and see how it works when applied to a real-life example. The model needs to perform a number of steps to calculate the expected number of travellers per railway segment. We deliberately entered the data from the municipality and CBS at the start of the process and the data from RET at the end to ensure that the model was adjusted and validated accurately. We will now focus on refining this model even further.’
The importance of data visualisation
It was incredibly useful for the municipality of Rotterdam to gain insight into the increasing levels of crowdedness and how this affects the city, as well as being able to map out people flows throughout the city from Central Station. Van Helvoort sums up the benefit: ‘If we understand which areas are busy and which areas are quiet, we can intervene and take action.’ Pothuis adds: ‘We were looking for ways to convert data into information and to present it in such a format that it would appeal to policy makers. Data visualisation has turned out to be a very effective tool in this regard. We learned a great deal on the Big Data course at Erasmus University and were grateful to receive input from CBS, which was very helpful. We particularly appreciated Yvonne Gootzen’s contribution throughout this process, who was the data scientist in our team. Our role mainly consisted of defining exactly which information the city required. This challenge demonstrates the value of teamwork and the course ensured we got off to a good start.’
‘A pragmatic approach to sharing and discussing data meant quick progress’
Adding more data
‘The results are beneficial to everyone involved, as all parties will use the insights gained for their individual organisations, but we were also able to achieve a collective goal,’ says RET’s Guido de Jongh. ‘Our next step will focus on further data verification to ensure our data for the different segments is correct. We will be working with a large and diverse group of RET data analysts to determine which of our available internal data should be added to the model to provide even more new insights.’
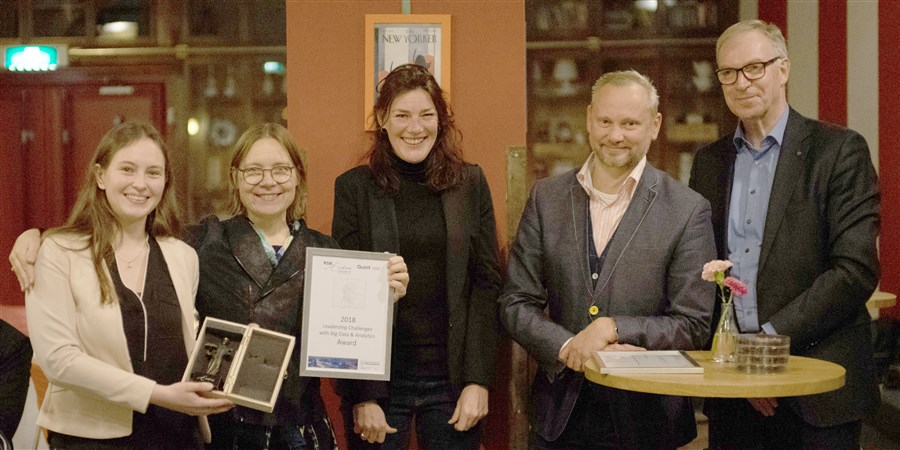
Winning an award
The entire mobility team is extremely pleased with the outcome of this challenge. Pothuis explains the benefits: ‘RET obtained information that will improve its operations, CBS was able to test its model and we, the municipality, were able to gain greater insight into the effects of our ever-growing city.’ De Jongh reflects on the process: ‘It was not easy trying to find a common objective that would benefit all parties involved, but by taking a pragmatic approach to the data and by discussing and sharing it with one another, we were able to make progress fairly quickly. We were all nervous while waiting to see whether the data would give the required insights. The first concepts concurred with our expectations, as the data visualisations corresponded with what we knew about our tube network. But it was not just the team members that were satisfied with the results – the jury was impressed with the mobility team’s proof of concept as well. The team received an award during the final presentations of this challenge, because they had come up with a product that gave both society and policy makers something tangible to work with.