Trends in the Netherlands: focus on images and infographics
Web publication
The publication Trends in the Netherlands has a long history. It is the successor of CBS’s first annual publication ‘Statistisch Zakboek’ (Statistical Pocketbook), first released in the early 20th century. For two years now, Trends in the Netherlands has also appeared as a web publication. CBS visual identity manager Irene van Kuik explains: ‘We are focusing on a broad audience: anyone interested in developments taking place in the Netherlands will find something to his or her liking.’ The front cover shows a swing ride located on Dam Square in Amsterdam. Van Kuik: ‘We consciously opted for this image: the swing ride provides a beautiful bird’s-eye view from above, of the city and the country, with the people who are living and working there.’[video: https://www.cbs.nl/en-gb/video/060ed759729e4b73ba9df093821aac70]
Three main themes
Trends in the Netherlands features three main themes: Society, Economy and Labour and income. The general trends are described first under each of these themes, followed by a large collection of figures per subtopic. For example, there is a new table showing the occupations chosen by graduates in primary teacher training. There is also an infographic showing the levels of happiness among the Dutch population broken down by married, single, divorced and widowed persons. As it turns out, married people are the happiest, but the difference between the percentages is not significant. Another graph visualises tension on the labour market: the ratio between the number of jobs and the number of job seekers. Then there is an infographic on specialist shops in the Dutch retail sector, indicating there are fewer greengrocers but more fish mongers and cheese shops. Van Kuik: ‘Trends in the Netherlands is a synopsis of all that CBS is able to provide. All statistical themes are incorporated.’Moving images
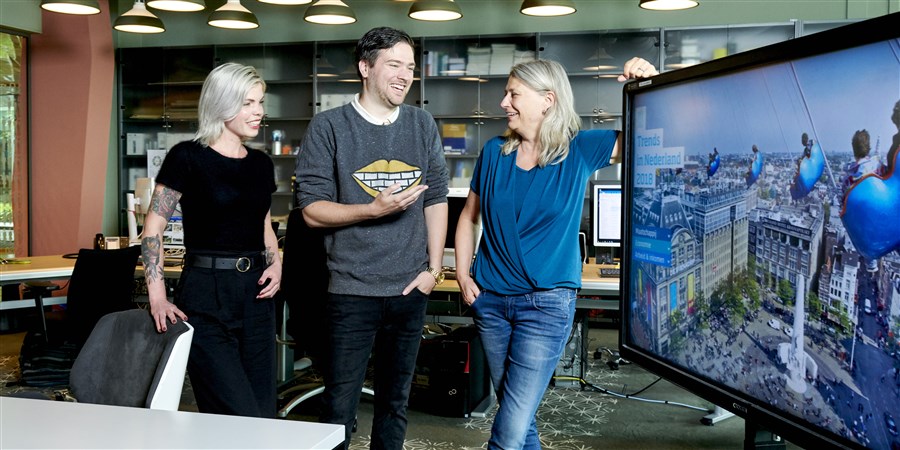
Presented in an accessible way, Trends in the Netherlands is a balanced overview of developments over the past year. A great deal of attention has been paid to images and infographics in this edition. The Creation and Visualisation department at CBS is responsible for this. Data visualiser Hendrik Zuidhoek explains: ‘We have done our utmost to create something special. Apart from the graphs, there are a lot of moving images. They allow us to convey the story behind the figures in an attractive way and without occupying too much space.’ All moving images were created by Zuidhoek and his colleague Anne Blaak. Blaak: ‘We’ve also made it easy for the news editors to create images and graphs by themselves. This is important to us, we believe in the power of images.’‘Trends in the Netherlands is a synopsis of all that CBS can provide’
Curious?
The web publication Trends in the Netherlands is available in both Dutch and English (using a language switch) and is easily legible on your PC as well as on your tablet and smartphone. CBS will be linking regularly to the publication via Twitter and Facebook. The edition is available in print from early November and can be obtained at the reception desk of the CBS offices in The Hague and Heerlen.Related items
- Publication - Trends in the Netherlands 2018
- News release - New edition Trends in the Netherlands