Half of all inbound goods destined for other countries
Volume flows of goods increased
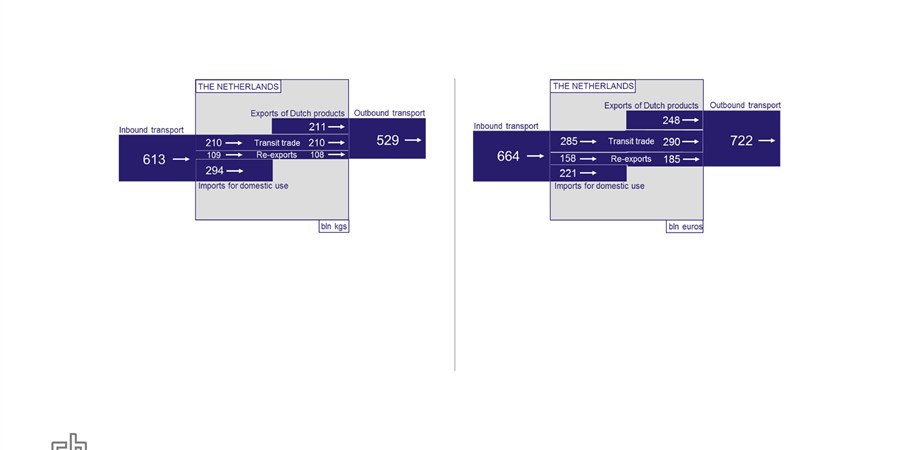
Last year, 613 bn kg of goods entered the Netherlands. The total value of these goods amounted to 664 bn euros, 7 percent more than in 2014. A total volume of 529 bn kg left the country. These goods represented a value of 722 bn euros. Compared to 2014, the weight and value of outbound flows of goods increased by 1 and 5 percent respectively.Over half of goods entering the Netherlands are either in transit or re-exported. Expressed in value, the share is even higher (two-thirds). Over the past five years, the share of transit trade and re-exports in international flows of goods of the Netherlands has grown marginally.
Fossil fuels and general goods dominant
In terms of weight, nearly half of imports consist of fossil fuels: petroleum, petroleum derivatives, natural gas and coal. For transit trade, this is 40 percent. In terms of value, half of imports consist of vehicles, machinery and general cargo, transit trade accounts for almost two-thirds. The product composition of exports resembles that of imports. There are also differences: the share of fossil fuels in the gross weight of exports is 5 percentage points lower and the share of chemical products is 7 percentage points higher than in imports. In the value of exports, too, fossil fuels have a smaller share than in imports: the difference is 3 percentage points. Agricultural and food products and chemical products, on the other hand, have a 4 to 5 percentage points larger share in the value of exported goods.Goods in transit generally from farther away than imported goods
In terms of gross weight, three-quarters of imports come from Europe. This applies to imports for domestic use and to imports for re-exports. Half of transit trade comes from Europe. Thirty percent of the goods in transit come from South or North America.
Europe’s share in the value of the goods is smaller: expressed in terms of value, more than 65 percent of imports for domestic use originate from Europe, 55 percent of the imports for re-exports and 45 percent of transit trade. In addition to Europe, Asia also has a relevant share in the value of goods: nearly 20 percent of imports for domestic use, nearly 30 percent of imports for re-exports and 40 percent of transit trade.
In terms of weight, 80 percent of exported goods are destined for Europe. The share for transit trade is even higher (more than 90 percent). With respect to the value of the goods, these shares are smaller: more than three-quarters of exports go to Europe and more than 80 percent of transit trade. Nearly 10 percent is destined for Asia.
| Agricultural and food products | Fossil fuels | Ores | Iron and steel | Raw minerals/construction materials | Chemical products/fertilisers | Vehicles/machinery/general cargo | |
|---|---|---|---|---|---|---|---|
| Gross weight in bn kg | |||||||
| inbound transit trade | 13.9 | 84 | 38.4 | 10.4 | 16.5 | 28 | 18.9 |
| imports for re-exports | 19 | 52.4 | 2.8 | 3.7 | 7.8 | 15.1 | 8.4 |
| imports for domestic use | 57.5 | 138.5 | 11.3 | 8.1 | 31.3 | 28.7 | 18.6 |
| Value in bn euros | |||||||
| inbound transit trade | 13.2 | 21.6 | 4.1 | 17.2 | 1.7 | 43.5 | 183.5 |
| imports for re-exports | 17 | 16.1 | 1.8 | 5.4 | 0.5 | 28.4 | 88.9 |
| imports for domestic use | 35.9 | 43.4 | 1.7 | 8.8 | 1.9 | 29.6 | 100 |
| Agricultural/food products | Fossil fuels | Ores | Iron and steel | Raw minerals/construction materials | Chemical products/fertilisers | Vehicles/machinery/general cargo | |
|---|---|---|---|---|---|---|---|
| Gross weight in bn kg | |||||||
| Outbound transit trade | 13.9 | 84 | 38.4 | 10.4 | 16.5 | 28 | 18.9 |
| Re-exports | 13.3 | 47.9 | 2.9 | 5.3 | 7.4 | 19.4 | 11.9 |
| Exports of Dutch products | 49.8 | 85.8 | 3.8 | 8.3 | 15.1 | 36.3 | 12 |
| Value in bn euros | |||||||
| Outbound transit trade | 13.2 | 21.9 | 4.1 | 17.6 | 1.7 | 43.5 | 187.8 |
| Re-exports | 20 | 18.3 | 2.1 | 6.3 | 0.6 | 33.1 | 104.7 |
| Exports of Dutch products | 60.1 | 36.8 | 2.4 | 8.5 | 1.6 | 48.7 | 89.5 |
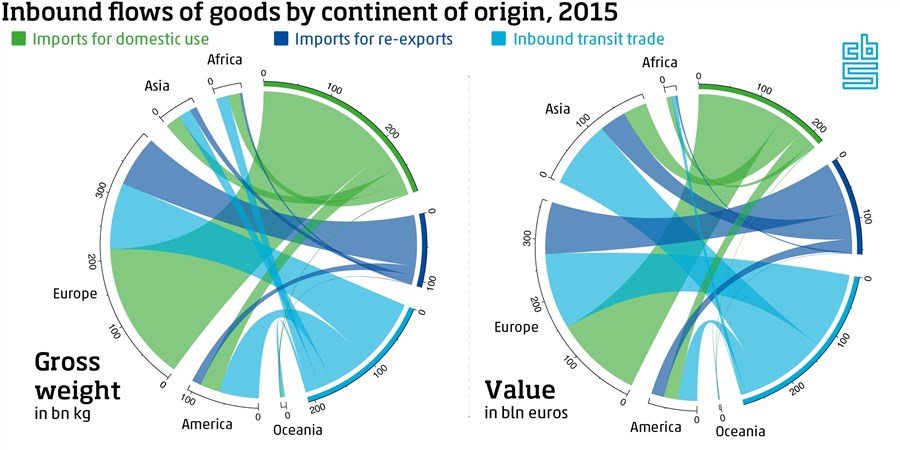
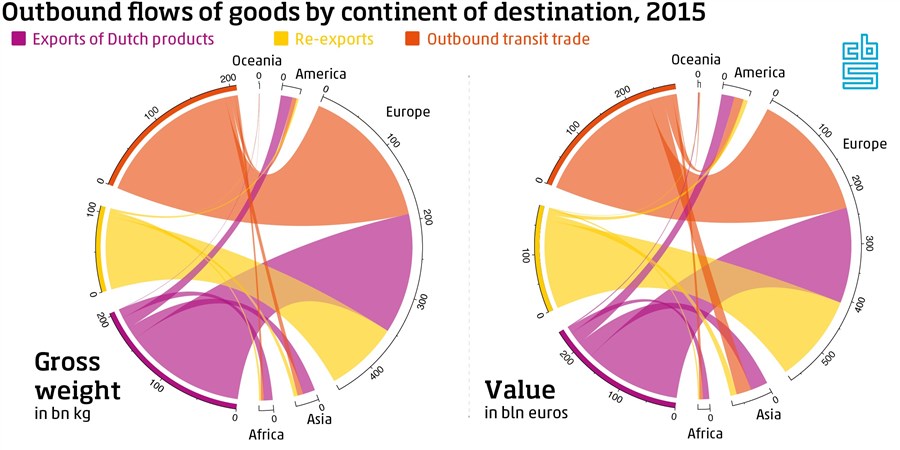
Expressed in kg and euros, which continents do the flows of goods to the Netherlands come from and which continents do the flows of goods from the Netherlands go to? The upper two circles reflect the three inbound flows (in colours) to the Netherlands from the five continents. These are found on the outside of the circle, together with the figures for gross weight in kg or value in euros. The thicker the arrow, the larger the flow of goods. The lower two circles reflect the outbound flows of goods from the Netherlands to the five continents.
Asian products relatively expensive
With an average value of 1.69 euros per kg for domestic use and 4.29 euros per kg for re-exports, products imported from Asia are relatively expensive. This is more than twice and nearly four times as high as the value of goods imported from Europe. Transit trade from Asia is even more expensive: 5.81 euros per kg. Transit trade from Europe has an average value of 1.25 euros per kg and is almost five times cheaper. These differences are due to the product composition of the goods flows. Products manufactured in Asia, like chemical products, vehicles, machinery and general cargo are relatively expensive.In the outbound flows of goods, the high values per kg for Oceania stand out: re-exports and transit trade to Oceania have an average value of more than 7 euros per kg. Products destined for America and Asia are also relatively expensive.
| Africa | America | Asia | Europe | Oceania | Other | |
|---|---|---|---|---|---|---|
| Inbound | ||||||
| inbound transit trade | 0.36 | 0.51 | 5.81 | 1.25 | 0.24 | 0.73 |
| imports for re-exports | 0.76 | 1.53 | 4.29 | 1.1 | 0.8 | 0.79 |
| imports for domestic use | 0.48 | 0.8 | 1.69 | 0.67 | 0.43 | 0.52 |
| Outbound | ||||||
| outbound transit trade | 1.76 | 3 | 3.73 | 1.23 | 7.34 | 1.48 |
| re-exports | 1.02 | 3 | 2.2 | 1.67 | 7.2 | 0.84 |
| exports of Dutch products | 0.98 | 1.52 | 1.92 | 1.09 | 4.6 | 0.8 |